U.S. Housing Starts and Permits
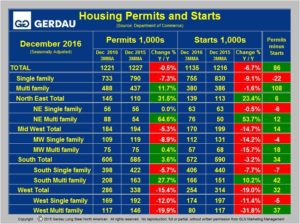
Total housing starts were reported at a seasonally adjusted annual rate of 1,135,000 for the month of December, on a 3MMA basis, down 6.7% from the November rate. Single family hoiusing starts declined 9.1 % 3MMA y/y, while multi-family fell 1.6% 3MMA y/y, (Table 1).
[caption id="attachment_1174" align="alignright" width="500"] Table 1[/caption]
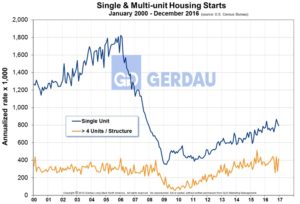
Figure 1 presents the long term view of housing starts for both single and multi-family back to the year 2000. At an approximately annual 800,000 single family rate, we are still 50% below the 1.2 million rate of 2000 and just 44% of the peak 1.8 million rate of 2006. Multi-family on the other hand at an approximately annual 380,000 unit rate has far exceeded its 200 through 2008 average of 297,000 units.
A forward looking gage of future housing construction can be gained by examining housing permits data. Permit activity is down 0.5% on a 3MMA y/y look, with single family off 7.3% but multifamily regaining traction, up 11.7%, 3MMA y/y.
[caption id="attachment_1172" align="alignleft" width="500"] Figure 1[/caption]
Regional data for both permits and starts in included in Table 5. Aggregate starts were down in three of the four regions. The North East was the only region to record growth up 23.4% 3MMA y/y, pulled up by a 53.7% surge in multi-family starts. Figure 2 compares the four regional growth curves from 2011 to present. The greater slope of the South illustrates the strong migration to this region of the US which according to the Census Bureau is expected to continue.
Inventories of homes was 4.2 months of supply (combined new & existing), in November. New home inventory was not available at publishing time but existing inventory fell sharply to 3.6 months, so total inventory is very likely less than 4 months’ supply. This is low by historic standards and is down 7.4% y/y, (Figure 3).
Foreclosures are approaching pre-recession lows, (Figure 4) reaching 85,919 in December, a 13.2% y/y decline and the lowest total since June 2006. Low inventory and low foreclosure totals coupled with low interest rate are combining to drive prices up.
Nationally the median price of houses sold including land was $305,400 in November, up 0.4% month on month and up 4.9% year on year.

