U.S. Housing Inventory and Prices
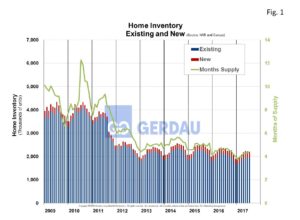
Existing home inventory in July fell 20,000 units or 1.0% month on month, (m/m) to 1.920 million, (M). On a year on year, (y/y) comparison inventory of existing homes fell 9.0%. Month’s supply was 4.2, down from 4.7 months in July 2016. New home inventory stood at 277,000 units, down1.8% m/m and down 10.6% y/y. Month’s supply of new homes was 5.8 months, up 0.6 of a month m/m and 1.4 months y/y. On a non-seasonally adjusted basis, (NSA) a total of 513,000 homes changed hands in July, down 14.5% m/m, flat y/y.
 Figure 1 shows inventory of new and existing houses from 2009 to present. Properties were typically on the market for 30 days in July up from 28 days in June but down from 36 days a year ago. Home buyer demand continues to very strong. New home construction levels continue to be at frustratingly low levels which is keeping the marketplace extremely competitive. Total existing-home sales slipped 1.3% to a seasonally adjusted annual rate, (SAAR) of 5.44M in July from a downwardly revised 5.51M in June. First time buyers represented 33% of sales up 1.0% both m/m and y/y. All cash sales, were 19% of sales, up 1% m/m, but down 2% y/y. Investors bought 13% of the home, down 2% y/y.
Low supply coupled with low interest rates results in higher prices. According to National Association of Realtors data, the national median price of existing home sales was $258,300 in July, up 6.2% y/y. The average price was $298,000, up 4.9% y/y. July’s price increase marks the 65th straight month of y/y gains. A persistent inventory shortage of existing homes is keeping prices elevated at the same time, demand is being geared up by a strong job market and low mortgage rates. In the past few years, growth in property values has consistently outpaced wage gains and is holding back potential new entrants to the housing market. Given the low inventory level and rising prices, coupled with low interest rates and strong employment gains, new home construction numbers should accelerate going forward.
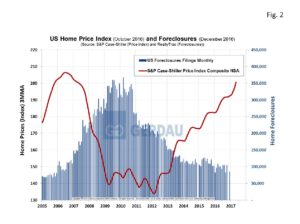
Figure 2 presents Case-Shuler home price index, from 2005 to present in both seasonally adjusted (SA), and non-seasonally adjusted (NSA), configurations on the left-hand Y axis and home foreclosure data on the right-hand Y axis. The chart shows that when foreclosures are as low as they were in the 2005 through 2007 period. The two data sets are near mirror images of one another. The June NSA Case-Shuler home price index score was 200.54, the highest value since November 2007. Distressed sales, foreclosures and short sales were 5% of sales in July up from 4% in June and unchanged from a year ago.
At Gerdau, we monitor the US housing market because historically new home construction has preceded non-residential construction (NRC), and therefore is an excellent barometer to foresee future demand for NRC.

