

U.S. Fabricated Beams Final Imports
Fabricated Beam final imports to the U.S. were down 25% YoY, and up 11% MoM in July 2019, coming in at 39,655 tons. There are four HTS codes considered in this report. These include: Bridge/Bridge Section, Fabricated Structural – Other, Fabricated Beams and Fabricated Beams – Other. Sixty-five percent of the volume is classified as Fabricated Structural – Other, 18% Fabricated Beams – Other, 17% Fabricated Beams and less than 1% Bridge/Bridge Section.
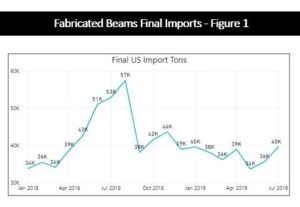 Figure 1 breaks down total final fabricated beam imports from January 2018 – June 2019. When comparing year to date figures from 2018 and 2019.
Figure 2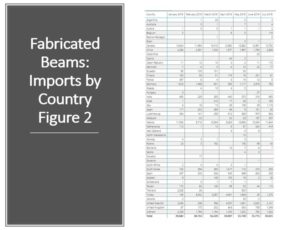 also charts the largest exporting countries in rank order for January – July 2019. Canada was the largest exporter of fabricated beams with 13,783 tons in July 2019. Mexico was the second largest exporter with 11,844 tons. China was the third largest rebar exporter of fabricated beams to the US with 2,849. Together these three exporters accounted for 72% of the total fabricated beam imports.
Laredo, TX port was the largest receiver of U.S. fabricated beams in July 2019, receiving 9,030 tons. St. Albans, VT was the second largest district of entry receiver coming in at 7,394 tons. Houston/Galveston, TX was the third highest receiver with 2,822 tons. Together these three district of entry accounted for 49% of the total imports.
At Gerdau we closely follow trade in long products steel since it has a profound impact on domestic market share and material pricing. We want you, our valued customers to have access to current information that can help you better plan and operate your businesses.