

SBQ Import Licenses
Special Bar Quality licenses year to date (YTD), for July totaled 287,527 tons, up 9.1% from last year’s YTD 263,614 tons. July license requests were for 45,857 tons, down slightly from the April, May, June average of 48,211 tons. Free cutting bar steel accounted for 55.1%, cold finished bars, 31.3% and hot forging bars for 13.5%.
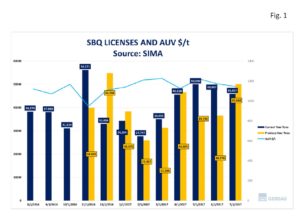 Figure 1 shows total SBQ licenses through July for both 2016 and 2017 as reported by the Steel Import Monitoring System (SIMA). The blue line tracks the Average Unit Value (AUV), in dollars per short ton. The average for AUV for July was $1,145 per ton which includes two HTS codes of alloy steel. Carbon steel AUV was $900 per ton in July and alloy was $1,827 per ton. Prices have drifted lower for two months in a row from Mays’ AUV of $1,223 per ton.
Figure 2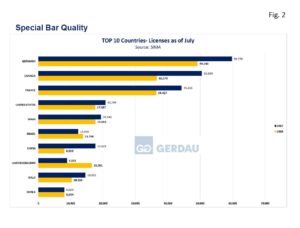 charts the YTD total by country for 2016 and 2017. Germany’s license requests YTD through July total 59,776 tons up 10,586 tons YTD y/y, (+21.5%). Germany’s July license requests were 6,257 tons, down 43% from its April, May, June average of 10,976 tons. Canada’s license requests YTD were 50,500 tons, up 13,930 tons YTD y/y, (+38.1%). Canada’s July license total was 5,604 tons, down 24.8% from its April, May, June average of 7,449 tons. France was the next largest exporter with 44,255 tons YTD, up from its YTD 2016 level of 36,427 tons, (-21.4%). July license requests were for 15,402 tons up 87.7% from its April, May, June average of 8,206 tons.
Spain’s YTD total license request of 19,343 was up 9.7% from its 17,633 tons in 2016. July’s license requests were for 2,877 tons down 12.9% from its April, May, June average of 3,302 tons. Brazil’s YTD licenses total was 12,319 tons, down 1,477 tons, (-10.5%), from its YTD 2016 total of 13,766 tons. July’s license request for July was for 2,307 tons down 15.8% from its April, May, June average of 1,992 tons. China’s YTD total stands at 17,628 tons, up 120% from its 2016 YTD total of 8,023 tons. China’s July’s to date licenses were for 3,144 tons 10.1% higher than its April, May, June average of 2,854 tons. The United Kingdom’s YTD license total was 8,881 tons, up 95.7% y/y from 2016 YTD total of 16,561 tons. The United Kingdom’s licensed 1,293 tons in July, down 14.2% from the 1,506 ton average during the April, May, June timeframe. Italy’s YTD license total was 8,881 tons, up 95.7% y/y from 2016 YTD total of 16,561 tons. Italy’s 1,293 tons in July, down 14.2% from the 1,506 ton average during the April, May, June timeframe. South Korea’s YTD license total was 8,029 tons, flat y/y from 2016 YTD total of 8,054 tons. South Korea’s licensed 530 tons in July, down 61.3% from the 1,373 ton average during the April, May, June timeframe.
Twenty-eight other countries exported SBQ product to the U.S. market YTD in 2017, thirteen in July. The total YTD was 26,837 tons, down 22.1% from 34,487 tons YTD in 2016. July’s total was 4,623, down 5.6% from the 4,886 tons during the April, May, June timeframe.
SBQ YTD license tonnage was higher year on year unlike all other long products that we monitor which showed significantly less imports since the section 232 was initiated by the Trump administration. This suggests that the exporters of SBQ product are confident that tariffs, duties etc. will not be retroactively administered on these goods.
At Gerdau we closely follow trade in long products steel since it has a profound impact on domestic market share and material pricing. We want you, our valued customers to have access to current information that can help you better plan and operate your businesses.