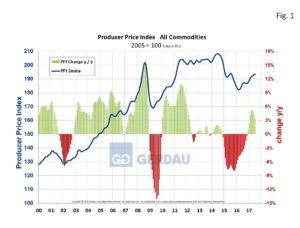
The U.S. producer prices index (PPI), for final demand decreased 0.1% in July. The unexpected decline in prices points to moderating inflation that may delay the FED from raising interest rates. For the 12 months ending July, the PPI rose 1.9%. The PPI for all commodities inched down 0.2% month on month (m/m), but was up 3.5% year on year (y/y), in July. Prior to this months’ decline, the all commodity index has increased on a three month moving average basis (3MMA), for eight consecutive months.
The Bureau of Labor Statistics (BLS), Producer Price Index (PPI) program measures the average change over time in the selling prices received by domestic producers for their output.
 Figure 1 shows the 3MMA, PPI for all commodities. The index began declining mid-2014, bottoming-out in March 2016. Since then the trend has been strong to the upside with most econometric indicators pointing to continued higher pricing going forward.
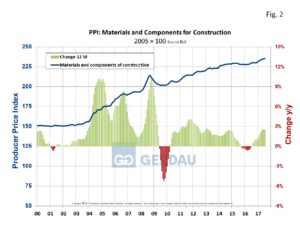
Figure 2  shows the 3MMA, materials and components PPI for construction. The material and construction components PPI increased by 0.2% m/m and by 0.7%, 3 months y/y. On a 12 months y/y metric, the material and construction component PPI gained 3.5%. This index has increased in each of the past eight months. The material and components for non-residential construction PPI rose 0.3% m/m, 0.8%, 3 months y/y. On a 12 months y/y metric, the PPI gained 2.8%.
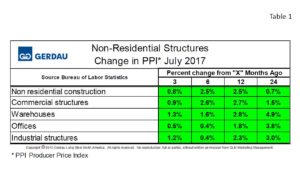
Table 1 presents a comparison of non-residential structures. The data lists the PPI in percentage change terms referencing timeframes 3, 6, 12 and 24 months ago. This tells us whether or not pricing is moving up or down over time. In the case of non-residential structures prices have been steadily increasing across the board for all structure types and for all time references. The overall number for all non-residential structures was up 0.8% over the past three months and up 2.5% y/y. Office structures moved-up the least, (0.5% over the past three months and up 1.8% y/y), while warehouses posted the largest prices increases, (1.3% over the past three months and up 2.8% y/y).
Turning to the PPI on raw steel products, prices are moving-up. Structural shapes were up 1.3% over 3 months and by 6.5% y/y, while the PPI for pipe, tube and hollow structural shapes recorded fell of 0.9% over 3 months, but was up 2.7% y/y.
The PPI for fabricated steel products is advancing more than its base materials. Fabricated structural steel for non-residential construction moved up 3.7% over three months and by 5.2% y/y. Fabricated structural steel for bridges did not increase as much. The PPI for these components rose 1.3% over 3 months and 2.3% y/y. Fabricated bar joist and fabricated rebar (grouped together in one category), also increased in price, up 3.1% over 3 months and up 4.9% on a y/y comparison.
At Gerdau, we monitor the PPI which is issued monthly from the Bureau of Labor Statistics because our past analysis has led us to believe that the BLS PPI numbers measure-up to real-world pricing. We feel it is important for us and our customers to know where we are pricing-wise relative to history and how we stack-up against competing materials.