Producer Price Index for Construction
The February Bureau of Labor Statistics producer prices index, (PPI) excluding food and energy, the final demand goods PPI rose 0.2% for the third consecutive month. The PPI for all commodities was up 0.8% month on month, (m/m). On a 12 month year on year, (y/y) comparison, the all commodities PPI rose 4.0%. Inflation beyond the 2% annual goal by the Federal Reserve will likely result in an interest rate hike later this month.
The PPI for final demand increased 2.9% y/y, compared with 2.6% in January. Final demand goods prices were up 3.1% y/y, vs. a 3.4% gain in January and a 3.6% rise in December. Services also rose increasing 2.8%y/y. Prices for intermediate processed goods increased 0.7% m/m and by 4.9% y/y. The PPI for intermediate unprocessed goods surged by 2.8%. On a y/y basis, intermediate unprocessed goods gained 5.5%.
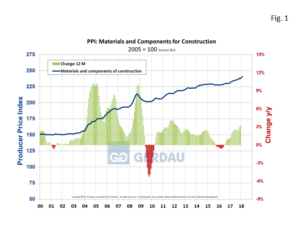
 Figure 1 shows the 3MMA, materials and components PPI for construction from 2000 to February 2017. The material and construction components PPI increased by +1.0% over three months, +1.7% over six months, +3.4% over 12 months and by +4.7% over a 24 month interval. On a rolling 12 month basis, the material and construction component PPI has advanced for 19 consecutive months.
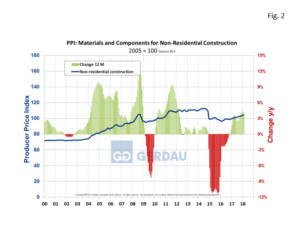
Figure 2 shows the 3MMA, material and components for non-residential construction PPI from 2000 to February 2017. The non-residential construction PPI rose increased by +1.0% over three months, +2.5% over six months, +4.1% over 12 months and by +7.3% over a 24 month timeframe. The non-residential construction PPI has been increasing at faster clip than the overall commodities index over the past 12 months. On a rolling 12 month basis, the material and construction component PPI has increased in each of the past 16 months.
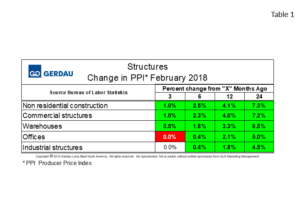
 Table 1 charts the PPI of structure types. This is the cost that a contractor would charge to build the building in question. Five types of structures are examined. On a 3 month y/y comparison, Commercial structures have increased in prices by 1.0% and were up 4.1% y/y. Warehouse structures increased by 0.5%, 3 months y/y and by 3.3% y/y. Office buildings price of construction were flat 3 month y/y and by 2.1% over a 12 month period. Industrial structures were also flat on a 3 month y/y comparison, industrial structures increased by 1.8% on a 12 month basis.
Construction material costs are also increasing; Steel mill products were up by 0.8% on a 3 month y/y comparison and higher by 6.4% on a y/y metric. Steel, (and aluminum) prices will likely continue to after the recent tariff announcement, (25% on steel, 10% on aluminum) by president Trump. Interestingly fabricated structural steel for non-residential buildings was down in price for both a 3 and 12 month y/y comparisons according to the BLS February PPI data. The 3 month number was lower by 0.5%, the 12 month number off 0.6%. This suggests greater bidding activity, (less work to bid on) on a national basis for non-residential construction. Steel and aluminum were not the only building materials to record higher prices: Softwood lumber was up 2.8% on a 3 month y/y comparison and higher by 14.4% y/y. Ready mix concrete posted a 1.2% gain on a 3 month y/y and 3.4% rise on a 12 month y/y comparison.
At Gerdau, we monitor the PPI which is issued monthly from the Bureau of Labor Statistics because our past analysis has led us to believe that the BLS PPI numbers measure-up to real-world pricing. We feel it is important for us and our customers to know where we are pricing-wise relative to history and how we stack-up against competing materials.

