Producer Price Index
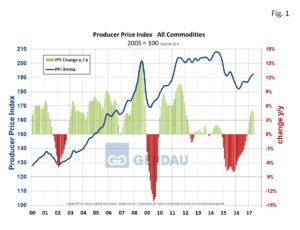
The PPI for all commodities came in at 192.9 off 0.10% month on month (m/m) but up 4.1% year on year (y/y), in May. This was first downward tick after five months of advances. The material and construction components PPI has increased for 13 months in a row on a three month moving average basis (3MMA).
 Figure 1 shows the three month moving average (3MMA), materials and components PPI for all commodities. The index began declining mid-2014, bottoming-out in March 2016. Since then the trend has been strong to the upside with all econometric indicators pointing to continued higher pricing going forward. The May index 3MMA value was 192.4, up 0.5 of a point over 12 months.
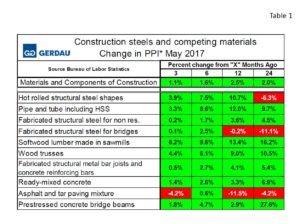
Table 1  presents construction steels and competing materials. The data lists the PPI in percentage change terms referencing timeframes 3, 6, 12 and 24 months ago. This tells us whether or not pricing is moving up or down and gives a relative comparison to competing materials. With the exception of asphalt and paving tar (-4.2% / 3 months & +0.6% / 6 months), all of the materials in this table have increased in price over both the past 3 and 6 month timeframes. Asphalt pricing fell in concert with oil making it more competitive with concrete paving. Softwood lumber has increased the most, up 8.2% over 3 months and up 13.4% y/y. The Trump administration imposed countervailing duties on Canadian lumber in April causing the price to rise.
Steel products including hot rolled structural shapes, pipe and tube are moving-up. Structural shapes were up 3.9% over 3 months and by 10.7% y/y, while pipe, tube and hollow structural shapes recorded increases of 3.3% and 12.0% over the same time references. Fabricated structural steel for non-residential construction and for bridges did not increase as much as the base materials. PPI for these components was up 0.2% and 0.1% over 3 months and 3.6% and down 0.2% over 12 months respectfully. Fabricated bar joist and fabricated rebar (lumped together in one category), also increased in price, up 0.5% over 3 months and up 4.1% on a y/y comparison.
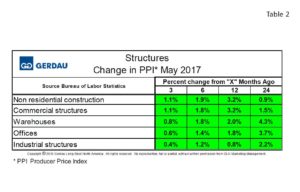
 Table 2 presents the 3MMA percentage change for five non-residential building structure classifications referencing timeframes 3, 6, 12 and 24 months ago. The PPI has increased for every time comparison for every category. Non-residential buildings overall increased by 1.1% over 3 months, 1.9% over 6 months and 3.2% on a y/y metric.

