

Portland Cement Shipments
U.S. national Portland cement shipments in December totaled 6.71 million, (Mt) short tons. For the three months total (3MMT), ending December, cement shipments were up 3.3% year on year, (y/y). Five of the nine census regions posted higher 3MMT cement shipments y/y.
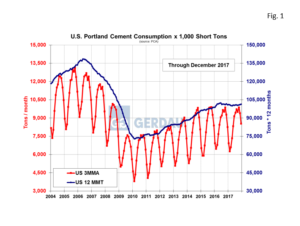 Figure 1 shows the three month moving average shipments in tons per month on the left-hand Y axis and the 12 month moving total on the right-hand Y axis. Note that 12 month moving total, (12MMT) growth has plateaued after steadily rising since the recession ended. Year to date through December, cement shipments totaled 101.31Mt, up a modest 0.4% y/y.
Figure 2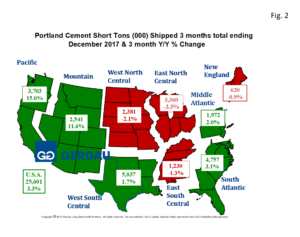 presents a map of the U.S. by census region. The tonnage values are in 3MMT and the percentage change is 3MMT y/y. Green denotes growth, red means decline. Shipment volume for the total U.S. market was up 3.3%, 3MMT y/y with shipments of 25.60Mt for the 3 months ending December 2017 compared to 24.77Mt for the same period last year.
The largest consuming region was the West South Central with 5.04Mt, up 1.7%, 3MMT y/y. The region with the second largest 3MMT consumption of 4.76Mt was the South Atlantic. Shipments in the South Atlantic increased by 3.1%, 3MMT y/y. The third highest consuming region was the West Coast, surpassing the East North Central. The West Coast posted a 15.0% gain 3MMT y/y to 3.70Mt. The East North Central regions’ consumption fell 3.3%, 3MMT y/y. The Mountain zone region posted a strong 11.6%, 3MMT y/y growth, consuming 2.54 Mt of cement. The West North Central’s cement consumption was down 2.1% 3MMT y/y to 2.38Mt. The Middle-Atlantic recorded an increase of 2.0%, 3MMT y/y, with 1.97Mt of cement consumed in the three months ending December. The East South Central cement consumption was down 1.2% 3MMT y/y to 1.23 Mt, while New England’s three month volume was 0.62Mt, falling 0.9%, 3MMT y/y.
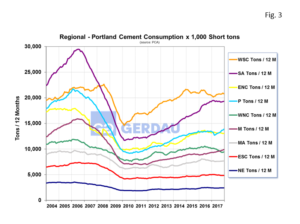 Figure 3 illustrates the census regions historic growth from 2004 to present. The two volume leading regions include the West South Central (19% of total U.S. shipments year to date), and the South Atlantic (17% of U.S. total shipments year to date).
The South Atlantic region had been trending steadily higher since the recession ended but has peaked and has flattened-out throughout all of 2107. The West South Central after falling through most of 2016, has reversed course and has been trending higher throughout 2017. The Pacific region staged a strong rebound after initially declining over the first five months of 2017. It now boasts the steepest growth trajectory of the nine census regions. The East North Central with 14.5% of total cement shipments has been trending in a slightly downward direction since mid-2017 as has the West North Central. The Mountain zone which accounts for 10% of total shipments has been trending steadily higher for two years. The Middle Atlantic consumed 8% of national shipments has seen its consumption plateau throughout 2017. The East North Central as well as the North East have also seen consumption plateau throughout 2017.
In the past cement consumption has shown a strong correlation with reinforcing steel usage. The historic ratio of rebar to cement has been between of 8 and 9%. In 2017 cement shipments totaled 101,310 Mt. Thus the range of expected consumption of rebar should be in the range of 8,104 to 9,918MT. Actual rebar consumption in 2017 was 8,577MT or 8.5%, right in the middle!
At Gerdau we routinely monitor Portland cement shipments because of its strong relationship to the consumption of rebar and because cement shipments give an excellent on how the overall construction, (infrastructure, residential and non-residential buildings), market is performing. Portland cement shipment data comes from the United States Geological Survey (USGS). Shipment data is two months in arrears.