Portland Cement Shipments
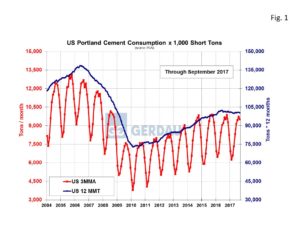
U.S. cement consumption fell in September to 9.32 million, (Mt) short tons from August’s strong volume of 10.27Mt. For the three months total (3MMT), ending September, national Portland cement shipments were flat year on year (y/y), basis at 28.55Mt. Six of the nine census regions posted higher 3MMT cement shipments y/y.
 Figure 1 shows the three month moving average shipments in tons per month on the left-hand Y axis and the 12 month moving total on the right-hand Y axis. Note that 12 month moving total, (12MMT) growth has plateaued after steadily rising since the recession ended. Year to date through September, cement shipments totaled 75.76Mt, down 0.5% y/y.
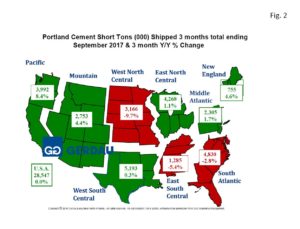
Figure 2 presents a map of the US by census region. The tonnage values are in 3MMT and the percentage change is 3MMT y/y. Green denotes growth, red means decline. Shipment volume for the total U.S. market was flat, 3MMT y/y with shipments of 28.55Mt for the 3 months ending September 2017 compared to 28.54Mt for the same period last year.
The largest consuming region was the West South Central with 5.19Mt, up 0.3%, 3MMT y/y. The region with the second largest 3MMT consumption of 4.83Mt was the South Atlantic. Shipments in the South Atlantic decreased by 2.8%, 3MMT y/y. Florida’s September shipments were just 0.45Mt down 24.1% from September 2016, no doubt impacted by hurricane Irma. The third highest consuming region was the East North Central which consumed 4.27Mt, 3MMT, advancing 1.1% y/y. The Pacific regions’ consumption surged 8.4%, 3MMT y/y to 3.99Mt, the largest percentage increase nationwide. The Mountain zone region posted 4.4%, 3MMT y/y growth for the three months ending September, consuming 2.75 Mt of cement. The mid-Atlantic recorded growth of 1.7%, 3MMT y/y, with 2.31Mt of cement consumed in July, August and September. The West North Central saw its cement consumption tumble 9.7% 3MMT y/y to 3.17Mt. The East South Central cement consumption was off 5.4% 3MMT y/y to 1.26 Mt. New England’s three month volume was 0.76Mt, rising 4.6%, 3MMT y/y.
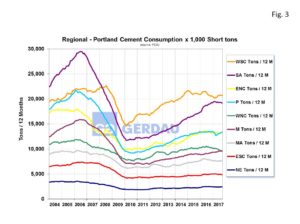
 Figure 3 illustrates the census regions historic growth from 2004 to present. The two volume leading regions include the West South Central (18% of total US shipments year to date), and the South Atlantic (17% of US total shipments year to date). The South Atlantic region had been trending steadily higher since the recession ended but has peaked and is now trending in a downward direction year to date. The West South Central after falling through most of 2016, has reversed course and has been trending higher thus far in 2017. The third largest consuming region over the past three months was the East North Central with 15% of total cement shipments. The Pacific region ranked the next largest with 14%, followed by the West North Central zone at 11% and the Mountain zone at 10%. The remaining three census regions combined to add up to 15% of total shipments.
Recent commentary on the Portland Cement Association, (PCA) website indicates that PCA expects cement consumption to rise over the next several years as a function of sustained economic growth even without added stimulus from tax reform and an aggressive infrastructure spending program. “Taking into consideration the positives of infrastructure spending and the potential offsets of higher interest rates, PCA’s baseline scenario suggests cement consumption reaches 112.7 million metric tons in 2021. Lacking any market or policy reaction by the Federal Reserve, even the most optimistic tax reform and most aggressive infrastructure spending initiatives suggest that cement consumption could reach as high as 128 million metric tons by 2021”.
At Gerdau we routinely monitor Portland cement shipments because of its strong relationship to the consumption of rebar and because cement shipments give an excellent on how the overall construction, (infrastructure, residential and non-residential buildings), market is performing. Portland cement shipment data comes from the United States Geological Survey (USGS). Shipment data is two months in arrears.

