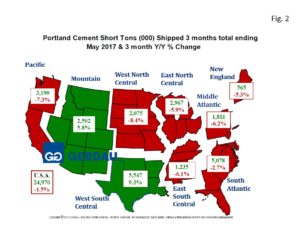
For the three months total (3MMT), ending May, national Portland cement shipments fell by 1.5% on a 3MMT year on year (y/y), basis. Seven of the nine census regions posted lower 3MMT cement shipments y/y. The Mountain and West South Central regions posted 3MMT y/y increases of 5.8% and 9.3% respectfully.
Portland cement shipment data comes from the United States Geological Survey (USGS). Shipment data is two months in arrears.
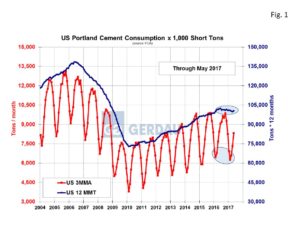
 Figure 1 shows the three month moving average shipments in tons per month on the left-hand Y axis and the 12 month moving total on the right-hand Y axis. As the inset circles illustrates, growth over the last several months has begun to taper-off. Year to date through May, cement shipments totaled 37.28 million short tons (Mt), down 0.9% y/y. In its spring forecast, the Portland Cement Association (PCA) forecasted that cement consumption would increase at an annual rate of 3.5% in 2017. Shipment volumes will have to accelerate considerably through the peak construction months of June through October for this forecast to become a reality.
Figure 2  presents a map of the US by census region. The tonnage values are in 3MMT and the percentage change is 3MMT y/y. Green denotes growth, red means decline. The country as a whole recorded a decline of 1.5% with shipments of 23.97 tons (Mt) for the 3 months ending May 2017 compared to 25.36 Mt for the same period last year.
The largest consuming region continues to be the West South Central with 5,547.18 Mt 3MMT as growth in the West South Central rose 9.3% 3MMT y/y. The region with the second largest 3MMT consumption, (5,078.40 Mt) was the South Atlantic which recorder -2.7% annual growth. The third highest consuming regions was the Pacific with 3,189.79 Mt. The Pacific regions growth fell 7.3% 3MMT y/y, largely a function of an extremely low shipping month in March (near record rainfall), in California. The East North Central consumed 2,966.97 Mt, 3MMT off 5.9% y/y. The Mountain zone region of the posted growth for the three months ending May, up 5.8% consuming 2,501.69 Mt of cement.
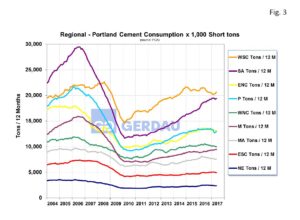
Figure 3 illustrates the census regions historic growth from 2004 to present. The two volume leading regions include the West South Central (22.2% of total US shipments over the 3 months), and the South Atlantic (20.3% of US total shipments over the past 3 months). The South Atlantic region has been picking up while the West South Central has fallen-off since the oil sector slowed down. In May the West South Central growth spiked, while the South Atlantic growth fell-back. The third largest consuming region over the past three months was the Pacific region with 12.8%. The East North Central region ranked the next largest with 11.9%, followed by the Mountain zone at 10.0%.
At Gerdau we routinely monitor Portland cement shipments because of its strong relationship to the consumption of rebar and because cement shipments give an excellent on how the overall construction (infrastructure, residential and non-residential buildings), market is performing.