

Oil and Gas Rotary Rig Counts
Active U.S. rigs climbed for the second week in a row per Baker Hughes. The total number of operating rigs in the U.S. the week as of February 2nd was 946, 765 oil and 181 gas. In percentage terms, on a month on month, (m/m) basis, oil rigs were up 3.1%, (+23 rigs) and gas rigs fell by 0.5%, (-1 rig). On a year on year, (y/y) comparison, rigs were up +31.2% for oil and +24.8% for gas. The combined figure was +29.8% or +217 rigs.
U.S. crude oil production rose to 9.919 million bpd, from 9.878 million bpd the week before, setting another new high and getting close to that psychologically important 10.0 million bpd mark. Goldman Sachs has held one of the most optimistic views on the rebalancing of the oil market and oil prices in the near term, and the investment bank is now growing even more bullish, predicting that the oil market has likely balanced, and that Brent Crude will reach $82 a barrel within six months. Goldman sees the price of Brent reaching $75 per barrel within three months, lifting its short-term oil price projection from the previous $62 forecast. “The rebalancing of the oil market has likely been achieved, six months sooner than we had expected,” the bank’s analysts said. “The decline in excess inventories was fast-forwarded in late 2017 by stellar demand growth, high OPEC compliance, heavy maintenance as well as collapsing Venezuela production,” Goldman noted.
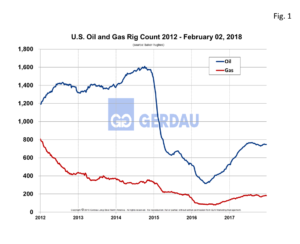 Figure 1 shows the Baker Hughes U.S. Rotary Rig Counts for oil and gas equipment in the U.S. from 2012 to present. Oil rigs rose steadily from 316 in late May 2016 topping-out at 768 last August. Since then the volume of rigs has plateaued and traded in a narrow range between 729 and 765. Gas rigs bottomed-out at 86 in August 2016 then rose steadily topping out at 192 late July last year. Gas rigs have been range-bound between 172 and 190 since then.
At the end of 2017, Texas had 464 rigs, plus one off-shore rig, (49% of the total), followed by Oklahoma with 117, (12%), New Mexico with 85, (9.0%). Louisiana had 43 on-land and 15 off-shore, (6%). North Dakota’s count was 45, (5.0%). These five states together account for 81% of the nation’s rig count.
Prices are moving up. Referencing Bloomberg Energy, West Texas Intermediate (WTI) crude oil in intraday trading was at $64.71 today, very close to its high for the year. Its range over the past 52 weeks has been between $43.91 and $66.66 per barrel. WTI crude has been trending higher since its recent low of $42.53 on June 21st. Brent crude oil in intraday trading was at $67.97 per barrel today. Its 52 week range was $46.71 to $70.78 per barrel. Brent crude has been trending higher since its recent low of $45.22 on June 21st. Natural gas in intraday trading today was at $2.76 per MMBtu today. It fell sharply over the past few days from a high of $3.61on March 29th to $2.76 per MMBtu. Its 52 week range was between $2.53 and $3.61 per MMBtu.
Canadian rotary rig count totaled 342 on February 2nd, 234 oil rigs and 108 natural gas rigs. These figures were up 138.8% m/m for oil and off 42.1% m/m for gas, +96.6% on a combined basis. Low production occurred during the Christmas and New Year’s weeks causing the huge percentage spike. On a y/y comparison, oil rigs were up 18.8%, while gas rigs decreased by 26.0% for a combined decrease of 0.3%. The province of Alberta had by far the greatest amount of rigs with 229, (67%), followed by Saskatchewan with 75, (22%) and British Columbia with 29, (8%).
At Gerdau we monitor rig counts along with the price of oil and natural gas since it has a major impact on long product sales to include Special Bar Quality sucker rods for downhole pumping strings to merchant and structural products for rigs and oilfield equipment.