Non-Residential Construction Starts
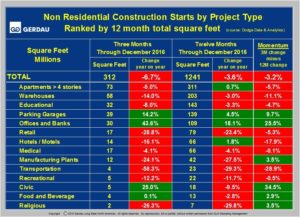
Square foot starts present a non-residential construction (NRC), market that was down in December on both 3 month y/y (-3.7%) and 12 month y/y (-6.7%) metrics, (Table 1).
[caption id="attachment_1184" align="alignright" width="500"] Table 1[/caption]
Looked at in expenditure terms, starts posts positive growth on both time comparisons, +22.5%, 3 months y/y and +4.4%, 12 months y/y, (Table 2). Figure 1 charts starts data in both dollar and square feet from 2002 to present. Note the arrows which show strong growth in expenditure terms as opposed to declining growth in square foot terms.
Figure 2 plots dollars per square foot, which ranges from a low of $115 / square feet in January 2002, (average $139 in 2002) to a high of $269 / square feet in December 2010 (average $259 in 2011). We apply a construction cost inflation adjustment to the expenditure data (constant 2010 dollars), but this does not correct for variance in project type. Since there is a large variance in the cost per square foot, expenditure starts do not give a sound outlook of future steel demand for NRC. For this reason, we prefer to use square feet starts because it gives an inflation proof, project resilient view into future demand for long product steel.
Where expenditure starts are valuable is for projects that are not under roof such as bridges, power transmission and sewer and water treatment facilities which cannot be measured square feet terms. Table 3 presents NCR expenditures for infrastructure projects. For the 12 months ending December the total expenditure was $812.7 Bn down 9.8% y/y. On a 3 month y/y basis, infrastructure projects jumped by 13.7% led by an 81.6% surge on streets and road spending and a 63.6% swell in other infrastructure project outlays. Momentum was strong at +23.5%.

