

Net Job Creation by Industry
In December net job creation was 156,000 which was down from 204,000 in November. October was revised down by 7,000 and November up by 46,000. Using a three month moving average, (3MMA), the result for December was 165,000 down from 182,000 in November.
[caption id="attachment_978" align="alignleft" width="500"]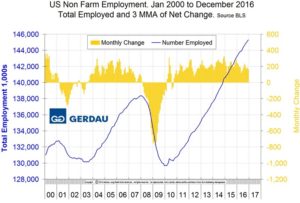 Figure 1[/caption]
Figure 1 shows the 3MMA of the number of jobs created as the brown bars since 1990. December was the 74th consecutive month of job growth however it looks as though a gradual slowdown is occurring. The high months in 2015 were lower than 2014 and that trend continued into 2016. In the big picture, layoffs are historically low and job openings are close to all-time highs therefore there seems to be no reason for pessimism. Manufacturing data has been disappointing this year as construction has been encouraging. Primary metals have shown signs of life in the last four months after contracting for 21 straight months. The last six months for the road hauling sector are encouraging and job losses in the oil fields have almost halted in the last four months. The results for manufacturing and construction are sign posts for steel sales activity.
Table 1 slices total employment into service and goods producing industries and then into private and government employees. Most of the goods producing employees work in manufacturing and construction. In December manufacturing gained 17,000 which was the best result since January 2016 but for the year as a whole lost 63,000 positions.
[caption id="attachment_983" align="alignright" width="500"]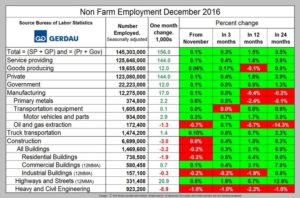 Table 1[/caption]
In December total manufacturing employment was 0.4% less than a year ago and 0.2% lower than two years ago. In the last three months primary metals have been doing better than manufacturing as a whole but much worse on one and two year comparisons. In December oil and gas extraction lost 1,300 jobs bringing the total loss for the year to 9,300 positions. Truck transportation added 1,400 people in December bringing the total for the last 6 months to 19,800. This followed a loss of 9.400 in the first half of the year. Motor vehicles and parts have picked up the pace a little in the last three months with gains of 1,000, 2,000 and 3,000 respectively.
Construction was reported to have lost 3,000 jobs in December with a total gain of 102,000 for the year. In spite of the weak December result, the last four months of 2016 had a total gain of 54,000 therefore there is no sign of a slowdown in the growth of construction employment.
The official unemployment rate, (known as U3) came in at 4.7% which up from 4.6% in November. This number is very misleading and doesn’t take into account those who have stopped looking. The more comprehensive U6 unemployment rate was down from 9.9% in January to 9.2% in December, the lowest since April 2008, (Figure 2). U6 includes workers working part time who desire full time work and people who want to work but have given up the search.
Initial claims for unemployment insurance, reported weekly by the Department of Labor have continued their downward drift this year and in w /e December 31st were 235,000 with a four week moving average of 256,750. This marks the longest streak since 1973 of initial claims below 300,000. (Figure 3).