

Manufacturing Capacity Utilization
Manufacturing capacity utilization (MCU), scored a 75.9% in March, a relatively flat % month on month, (m/m). On a year on year (y/y) comparison the MCU was up 2.2%.
Manufacturing fundamentals continue to improve. Both the U.S. and global economy are strengthening and at the same time, the dollar has depreciated against the Broad Index, (basket of countries’ currencies that the U.S trades with). In addition, inventories that were previously seen as a drag on production have now shifted to a supporting role.
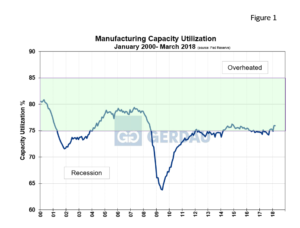 Figure 1 charts capacity utilization from 2000 to present. The MCU index is currently in the green zone which is considered to be ideal. After a long run at the bottom of the “green zone”, the index has begun to move higher scoring.
The ISM manufacturing index recorded a value of 59.3 for March, with new orders at 6 1.9and production at 61.0. All numbers were solidly in the expansion zone. Manufacturing employment was 12,632 million at the end of March, up 22,000 month on month, and up 232,000 year on year, (+1.87%).
The Bureau of Economic Analysis reported that the U.S. annualized GDP grew by 3.2% in the fourth quarter, down marginally from its previous estimate of 3.3%. The U.S. economy has expanded for three quarters by 3% or more, and most analysts expect the streak to continue and possibly increase to the 3.5% range. With the passage of comprehensive tax bill it is probable that many manufacturing firms will increase their investments. Overall, this month’s manufacturing capacity utilization was very positive.
At Gerdau we regularly monitor the manufacturing capacity utilization date issued by the Federal Reserve because it provides excellent insight into the health of US manufacturing activity. We know that when manufacturing is performing well, so are steel sales and want to keep you our valued customers and readers informed.