Industrial Construction Starts
January US starts posted $189.9 Bn, down 9.7%, 12 months y/y. On a 3 month year on year basis starts rose 7.7%, pushing momentum to a positive 17.5%. In total of the 12 project categories, 9 recorded growth on a 3 month year on year (y/y) basis, while only six saw growth on 12 month y/y basis.
Triple digit surges were recorded for both Petroleum refining and Alternative fuel, (Table 1). Over 12 months Petroleum refining was up 91.3%, while Alternative fuel fell 1.3%. Three other project group approached double growth 3 months y/y including Transmission oil_. & gas (+98.9%), Chemical processing (+99.4%) and Production oil_. & gas (+85.1%). Industrial manufacturing also recorded solid growth, up 50.2%, 3 months y/y. On the downside, Power projects plummeted 84.5% on a 3 month y/y and were off 35.4% over on a 12 month y/y comparison. Pulp, paper & wood, Terminals and Metals & minerals also recorded declines for both 3 and 12 month y/y comparisons.
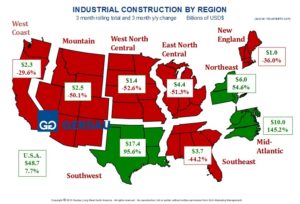
[caption id="attachment_1176" align="alignright" width="500"] Figure 1[/caption]
Figure 1 illustrates US industrial starts by consensus region showing the 3 month y/y change in percent as well as the 12 month expenditure. The nation as a whole saw industrial starts increase by 7.7% y/y. However, when looked at on a regional comparison, there was tremendous volatility. Regions recording increased industrial construction starts include; The Southwest (+95.6%), the Northeast (+54.6%) and the Mid-Atlantic (+145.2%). All other regions recorded declining activity 3 months y/y. The increase in the Southwest which had posted 14 consecutive months of percentage point decline on a 12 months y/y measure is due to a resurgence in energy related projects as the price of West Texas Intermediate has doubled in price from its low of $26.21 per barrel on February 2, 2016 to today’s price of $53.45 per barrel, (January 26, 2017).
Canadian Industrial Construction Starts fell 24.7%, 12 months y/y. Projects have trended downward since the end of the oil_. sands boom between 2012 and 2014, (Figure 2). The December 2016 rolling 12 month total was $13.9 Bn. In 2015 the total was $29.5 Bn and it was $56.0 Bn in 2014. The 12 month running total peaked in 2013 at $77.5 Bn. A continued revival in energy prices and industrial manufacturing projects will help reverse the downward slide.

