

Growth of US GDP Q3 2017 (first estimate)
According to the Bureau of Economic Analysis, (BEA), U.S. real GDP remained strong in Q3 coming in at 3.0% on an annualized basis, down a tick down from the 3.1% rate recorded in Q2. The BEA noted that hurricanes disrupted data from production, agriculture, rebuilding and emergency services but did not specifically qualify the impact in this report. In addition, the catastrophic damage in Puerto Rico and the Virgin Islands are not included in the GDP data. Consumer spending and inventory build-up were the main growth drivers in Q3.
GDP is a measure of the total production and consumption of goods and services in the U.S. This is the broadest measure of economic output. The Bureau of Economic Analysis (BEA), constructs two complementary measures of GDP, one based on income and one based on expenditures. GDP is measured and reported in chained 2009 dollars. The growth calculation is misleading because it takes the Q over Q change and multiplies by 4 to get an annualized rate. This makes the high quarters higher and the low quarters lower.
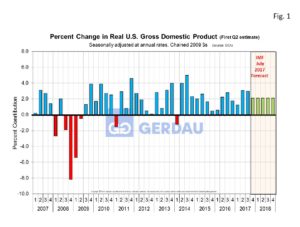 Figure 1 shows the headline quarterly results since 2007 and the July International Monetary Fund (IMF), forecast through for 2017 and 2018. On July 24th, the IMF forecast for the year 2017 was revised down 0.2 percentage points to 2.1% GDP growth. The IMF forecast for 2018 was also 2.1%. First quarter growth was just 1.2%, however with 3.1% and 3.0% growth in the Q2 and Q3 it appears that the U.S. economy will exceed the pessimistic 2.1%, 2017 IMF forecast when the books close on 2017.
The six major components that add to make up the headline GDP number include: Personal consumption, Fixed Non-residential investment, Fixed Residential investment, Inventories, Net exports and Government. Personal consumption contributed 1.62 percentage points, Fixed Non-residential investment contributed 0.49 percentage point, Fixed Residential investment declined, subtracting 0.24 percentage point. Net exports contributed 0.41 point, while Government spending was a negligible drag, pulling GDP down by 0.02 points. Year on year, annualized GDP advanced 0.21 percentage points compared to Q3-2016.
Real domestic income increased 0.6% in Q3. The personal saving rate in Q3 was 3.4%, down 0.4 percentage points from Q2, the lowest rate since 2007. Inflation in Q3, (excluding food and energy) was 1.5%, 0.3% higher than in Q2.
Global GDP growth is picking-up and is now projected at 3.5% in 2017, accelerating to 3.6% in 2018.
The U.S. economy has been expanding for eight years now and looks to continue to grow at its trend rate of about 2% going forward. Unemployment at 4% is considered to be at full-employment, yet the tighter labor market has not ignited substantial upward pressure on either wages or inflation. The economy is not overheating at the present time, but inflationary pressures could mount as wage pressures build in a tight labor market. History has shown that when wage and price pressures build that the economy is in the late expansionary phase.
Hurricanes do not appear to have had much effect on growth and will likely add to growth over the next several quarters as rebuilding takes place in earnest.
Businesses are profitable, interest rates are low and the stock market is in record territory. In addition, all major global economies are expanding for the first time in a decade.
Concerns on the horizon center around the federal government’s course of action, specifically tax and spending policy, passing a budget and tackling the dept ceiling.
At Gerdau we regularly evaluate the quarterly BEA GDP report to get a read on current economic strength as well as a “read” on the likely short-run future.