

Global Crude Steel Production and Capacity Utilization
Worldsteel Association (WSA) reports that global crude steel production totaled 138.823 million tonnes (Mt) at a capacity utilization rate, (CUR) of 70.0% in January. Production was up by 1.380 Mt month on month as the CUR was up 0.7 percentage points over December. On a year on year, (y/y) comparison, global crude steel production in January increased by 1.171 Mt as the CUR rose 0.2 percentage points.
On a three month moving average, (3MMA) basis the rate of annualized production rate through January was 1,656.2 Mt. WSA estimates that current global capacity stands at 2,390 Mt, thus, the annual excess global capacity at current operating rates is approximately 734 Mt. Â Most analysts estimate that between 450M to 500M of the overcapacity resides in China. For the 12 months ending January total worldwide raw steel production totaled 1,689.2 Mt, up 76.40 Mt year to date y/y or 4.7%.
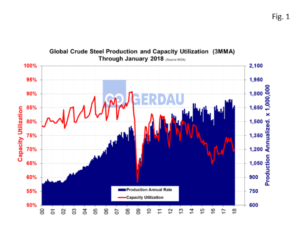 Figure 1 charts global steel production on the right-hand Y axis and percent CUR on the left-hand Y axis. Both capacity utilization and crude steel production trended higher for most of the year until September, at which point both metrics reversed direction. Â January is showing the first uptick since then.
Figure 2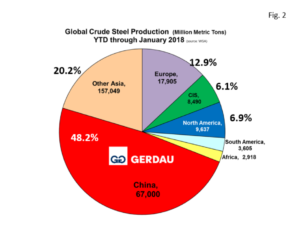 shows a pie chart of raw steel production by region YTD, through January 2018. China with 67,000 Mt YTD, -0.9% y/y, accounts more than half, (48.2%) of global raw steel production. This is the first time in several months that Chinas share has been less than 50% I several months.
The next biggest slice was other Asia with 28,047 Mt, +4.0% y/y, accounting for 20.2% of the global total. Countries in other Asia include: India, Japan, South Korea, Pakistan, Taiwan, Thailand and Vietnam. Â Adding China + other Asia, accounts for 68.4% of global steel output.
Europe was the next largest producing region YTD with 19,905 Mt, +3.7% y/y and accounting for 12.9% of the global total.
North America (which includes Canada, U.S. and Mexico as well as Cuba, El Salvador, Guatemala, Trinidad & Tobago), produced a combined 9,637 Mt, -2.1% y/y, accounting for 6.9% of global output.
The CIS countries (Byelorussia, Kazakhstan, Moldova, Russia, Ukraine and Uzbekistan) combined tonnage was 8,490 Mt YTD, -1.8% y/y, representing for 6.1% of the global total. South America accounted for 3,605 Mt, up 3.2% y/y, accounting for 3.2% of the global total. Africa's tonnage YTD was 2,918, +11.4% y/y, it accounted 2.1% of the global total.
The Worldsteel Associations January 24th press release stated: World crude steel production reached 1,691.2 million tonnes (Mt) for the year 2017, up by 5.3% compared to 2016. Crude steel production increased in all regions in 2017 except in the CIS, which has remained stable (subject to current estimates). This release did not offer a forecast. Worldsteel has historically issues its forecasts twice per year in April and October.
At Gerdau we keep a keen eye on Global crude steel production and capacity utilization because of its huge impact on global trade and its influence on domestic pricing.