

Global Crude Steel Production and Capacity Utilization
Worldsteel Association (WSA) reports that global crude steel production totaled 143.58 million tonnes (Mt) at a capacity utilization rate, (CUR) of 72.2% in August. On a year on year, (y/y) comparison, the capacity utilization rate was up 3.7 percentage points, a significant increase.
For the seven months ending August total worldwide raw steel production totaled 1,122.4 Mt, up 57.23 Mt year to date y/y or 5.4%. On a three month moving average, (3MMA) basis the rate of annualized production rate was 1,712.6 Mt. WSA estimates that current global capacity stands at 2,386 Mt, an increase of 58 Mt y/y. Thus, the annual excess global capacity at current operating rates is approximately 673 Mt.
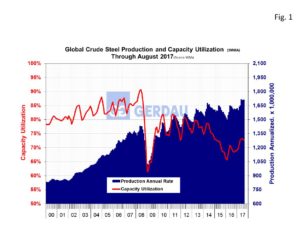 Figure 1 charts global steel production on the right-hand Y axis and percent CUR on the left-hand Y axis. Both capacity utilization and crude steel production are trending up thus far in 2017.
Figure 2 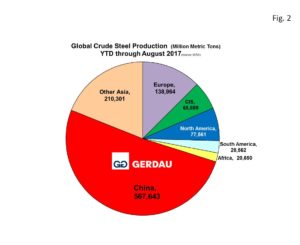 shows a pie chart of raw steel production by region YTD, through August 2017. China with 567,643 Mt YTD, +5.4% y/y accounts more than half, (50.6%) of global raw steel production. China’s ratio of global steel production increased by 0.2 percentage point YTD y/y. The next biggest slice is “other Asia” with 210,301 Mt or 18.4% of the global total, up 0.2 percentage point y/y. Countries in “other Asia” include: India, Japan, South Korea, Pakistan, Taiwan, Thailand and Vietnam. Adding China + other Asia, accounts for well over two thirds, (69.0%) of global steel output.
The Europe (EU27), was the next largest producing region YTD with 138,964 Mt, accounting for 12.4% of the global total, down 0.1 percentage point YTD y/y. The CIS countries (Byelorussia, Kazakhstan, Moldova, Russia, Ukraine and Uzbekistan) combined tonnage was 65,889 Mt YTD for 5.9% of the total, unchanged YTD y/y. South America accounted for 28,562 Mt, (2.5% of the global total, unchanged y/y). Africa accounted for 20,650 Mt, (1.8% of the global total, unchanged y/y).
North America (which includes Canada, US and Mexico as well as Cuba, El Salvador, Guatemala, Trinidad & Tobago), produced a combined 77,561 Mt, accounting for 6.9% of global output. North Americas’ share of global output remains the same as its 2016 share.
The Worldsteel Association’s has not released an updated short range outlook since April 21, 2017. In its April edition, WSA projected that 2017 crude steel production would increase by 0.5% to 1,535.2 Mt y/y. It now appears that this forecast is on the low side by some 148 Mt if we annualize the current global production rate.
WSA also predicted a 2.2% increase for the NAFTA region. Year to date through August, U.S. + Mexico + Canada crude steel production = 77.17 Mt, up 3.7% YTD y/y.
At Gerdau we keep a keen eye on Global crude steel production and capacity utilization because of its huge impact on global trade and its influence on domestic pricing.