

Global Crude Steel Production and Capacity Utilization
Worldsteel Association (WSA) reports that global crude steel production totaled 146.7 million tonnes (Mt) at a capacity utilization rate, (CUR) of 76.2% in January. On a year on year, (y/y) comparison, global crude steel production in October decreased by 3.79 Mt as the capacity utilization rate remained flat in percentage points. On a three month moving average, (3MMA) basis the rate of annualized production rate through January was 1,760 Mt.
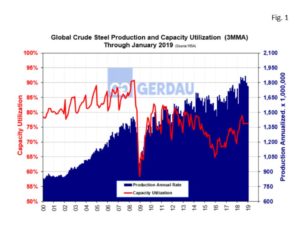 Figure 1 charts global steel production on the right-hand Y axis and percent CUR on the left-hand Y axis. Both capacity utilization and crude steel production are trending sharply higher year to date, (YTD) 2019.
Figure 2 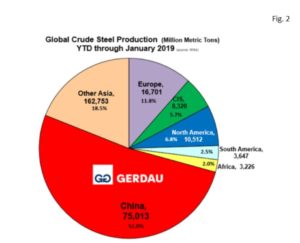 shows a pie chart of raw steel production by region YTD, through January 2019. China with 75,013Mt YTD, +4.3% y/y accounts over half, (51.3%) of global raw steel production. The next biggest slice was “other Asia” with 27,542 Mt or 18.8% of the global total. Countries in “other Asia” include: India, Japan, South Korea, Pakistan, Taiwan, Thailand and Vietnam. Adding China + other Asia, accounts for almost two thirds, (70.1%) of global steel output.
Europe was the next largest producing region YTD with 16,701 Mt, accounting for 11.4% of the global total. The CIS countries (Byelorussia, Kazakhstan, Moldova, Russia, Ukraine and Uzbekistan) combined tonnage was 8,320 Mt YTD for 5.7% of the total. South America accounted for 3,647 Mt, 2.5% of the global total. Africa accounted for 3,226 Mt, 2.2% of the global total.
North America (which includes Canada, US and Mexico as well as Cuba, El Salvador, Guatemala, Trinidad & Tobago), produced a combined 10,512 Mt, accounting for 7.2% of global output..
At Gerdau we keep a keen eye on Global crude steel production and capacity utilization because of its huge impact on global trade and its influence on domestic pricing.