Construction put-in-place (CPIP) May 2017
CPIP data released today (July 3rd), yielded mostly positive results. Overall total non-seasonally adjusted (NSA), constant dollar construction was up 4.4% year on year (y/y). Private expenditures advanced 7.6% y/y, while, State & Local contracted by 3.8% y/y.
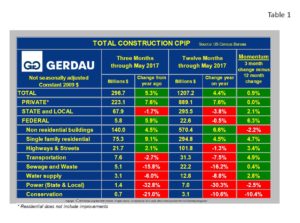
Total Construction: On a three month total rolling expenditure y/y comparison, total construction came in at $296.7 billion (B), +5.3% with positive 0.9% momentum, (momentum is defined as 3 month minus 12 month). The 12 month running total was 1.207B, (Table 1) .
.
Private construction accounted for 74% of the total three months expenditures ending in May. State & local spending accounted for 23% with 2% for federally financed projects. The private sector posted 7.6% growth for both 3 and 12 month y/y comparisons resulting in flat momentum. The rate of growth has been slowly falling in percentage terms, yet has remained positive for 68 consecutive months. Single family residential construction recorded 9.1% growth on a three month basis, far stronger than the 4.5 %, 12 month y/y score.
State and local total construction contracted further this month, off 3.8% on a rolling 12 month basis. This value been negative for nine months in a row. On a rolling three y/y comparison, growth was down 1.7%, now down for 12 consecutive months. The good news is that momentum was positive 2.1%.
Federal construction spending on the 3 month total rose 5.9% y/y to $5.8B, up from negative 0.5% on a 12 month basis, leading to 6.3% positive momentum. This is significant because it was the first positive growth recorded for the rolling three month metric in 12 months.
The infrastructure project groups posted negative growth for both 3 and 12 month y/y comparisons across the board. The one exception was highways and streets which recorded a positive 2.1% growth on a rolling 12 month basis. The other encouraging trend in an otherwise dismal infrastructure report, is that four of the six categories posted positive momentum to include: highways and streets (+3.4%), transportation (+4.9%), sewage & waste (+0.4%), water supply (+2.8%). Power (State and Local) and conservation each had negative momentum of +2.5% and -10.4% respectfully.
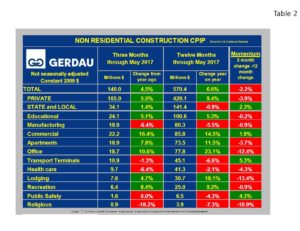
Non-residential Construction: Table 2 shows the breakdown of non-residential construction (NRC). The overall growth rate was 4.5% on a 3 month y/y basis and 6.6% on a 12 month y/y comparison resulting in -2.2% momentum.
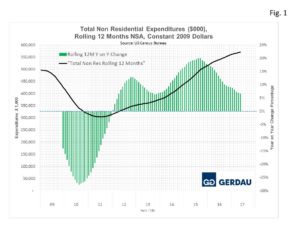
The growth rate of private NRC was 5.5% for the three months ending May, less than the rolling 12 month value of 9.4% but still showing strong growth.  Figure 1 charts the NSA rolling 12 month expenditure history from 2009 to present. Expenditures (black line) are read on the left Y axis in constant 2009 dollars. The year on year change, (green bars) are read off the right Y axis. Total non-residential expenditures are at the highest level since our history began.
Looking at the project categories within non-residential buildings, some are strong while others are declining. Commercial, apartments (>4 stories), office, education, lodging and recreation construction are all witnessing growth on both 3 and 12 month rolling total y/y metrics. These range from 4.7% for lodging (rolling 3 month y/y), for to 16.4% for commercial construction.
Sectors that are recording contracting expenditures (rolling 3 month y / y), include: manufacturing buildings, transport terminals healthcare, public safety and religious structures.
At Gerdau we monitor the CPIP numbers every month to keep you, our customers informed on the health of the US construction market. The present market continues to record solid gains in the private sector, while the public sector continues to wane.

