Construction Put-in-Place, (CPIP)
Total U.S. construction spending continued to perform well in February, especially in the public sector. Census Bureau non-seasonally adjusted (NSA), constant dollar CPIP data showed that January’s twelve month total, (12MT) construction expenditures grew by 3.7% year on year (y/y), to $1232.7 billion (B). On a 12MT basis, private expenditures advanced 5.5% y/y, while, State & Local contracted by 1.4% y/y. Non-residential 12MT CPIP increased by 1.6%, 12MT y/y to $571.2B.
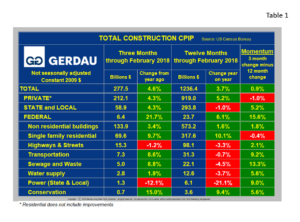
Total Construction:  Table 1 presents CPIP data for total construction for both 3 moving total and 12 month moving total y/y metrics. Momentum, defined as 3MT minus 12MT is also shown. Momentum provides market direction with green indicating stronger activity and red indicating slowing activity. Private construction accounted for 76.4% of the total three months expenditures ending in February. State & local spending accounted for 21.2%, the remaining 2.3% was for federally financed projects. The private sector posted 4.3% and 5.2% growth for 3MT and 12MT y/y comparisons resulting in negative 1.0% momentum for the month of February.
Single family residential construction recorded 9.7% growth on a 3MT basis, weaker than the 10.1%, 12MT y/y score, resulting in slightly negative momentum of -0.4%.Nationally there is a significant undersupply of existing homes causing prices to rise. A strong job market, low interest rates and pent-up demand is driving demand. This trend is expected to continue throughout 2018.
On 12MT basis, State and Local total construction was in the red, down 1.0%. However on a 3MT month y/y basis, State and Local total construction recorded a 4.3% increase in spending. This was the fourth month in a row of positive growth on a 3MT y/y basis, after a string of 17 months of negative numbers. In a further encouraging sign, momentum was +5.2%. Federal outlays recorded an increase of 6.1% on a 12MT basis and a much stronger +21.7% on a 3MT comparison.
The infrastructure project groups recorded negative growth on a 12MT y/y comparison for all groups except Conservation which was higher by 9.4%. On an optimistic note, every category recorded positive momentum in February except Highways & Streets and Power, indicating that spending is accelerating.
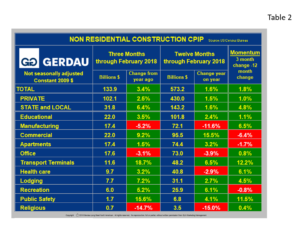
Non-residential Construction: Table 2 shows the breakdown of non-residential construction (NRC). The overall growth rate was +3.4% on a 3MT y/y basis and +1.6% on a 12MT y/y comparison resulting in a upward 1.8% momentum.
The growth rate of private NRC was +2.5% for the 3MT ending February, less than the rolling 12MT value of +1.5%, leading to a positive momentum score of 1.0%. This is the first positive growth rate for the 3MT y/y metric after a run of four month in a row that the 3MT y/y growth rate has been negative, an encouraging turn-a-round.
State and local expenditures were positive for both 3MT and 12MT metrics. The 3MT y/y increase was +6.4%, stronger than the 1.6%, 12MT y/y growth giving rise to positive momentum of +4.8%. February’s positive percentage posting marks six consecutive months of growth on 3MT y/y basis and five months in a row of positive percentage growth on a 12MT y/y comparison.
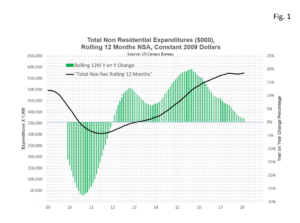
 Figure 1 charts the NSA rolling 12MT expenditure history for non-residential construction from 2009 to present. Expenditures (black line) are read on the left Y axis in constant 2009 dollars. The year on year change, (green bars) are read off the right Y axis. Total non-residential expenditures was recently at its highest point since our data began. It has now started to plateau. While expenditures remain at elevated levels, the y/y percentage change is on a continuous downward slope.
Looking at the project categories within non-residential buildings, most are exhibiting strong growth while others are declining. Educational, Commercial, Apartments, Recreation and Transportation Terminals, Lodging, and Public Safety construction all recorded positive growth on both 3MT and 12MT y/y metrics.
Sectors that are recording contracting expenditures on both rolling 3MT and 12MT y/y comparisons, include: manufacturing buildings, office buildings, and religious structures.
Religious structures recorded the weakest performance, down 14.7% and 15.0% for 3MT y/y and 12MT y/y respectfully, a negative trend for 18 consecutive months on a 3MT y/y. Manufacturing buildings recorded a -5.2% and -11.6% for 3MT y/y and 12MT y/y respectfully. Three month y/y total manufacturing expenditures have been in the negative column for 23 months in a row. Prior to that there was a 57 consecutive month period of strong growth in this sector.
At Gerdau we monitor the CPIP numbers every month to keep you, our customers informed on the health of the U.S. construction market.

