Construction put-in-place (CPIP)
April CPIP data released June 1st, yielded mixed results. Overall total construction recorded positive growth for both 3 month and 12 month year on year, (y/y) comparisons. Private expenditures showed growth on both time metrics as well. However, both State & Local and Federal spending continued to contract.
The data presented in this report are not seasonally adjusted (NSA) and are in constant 2009 dollars.
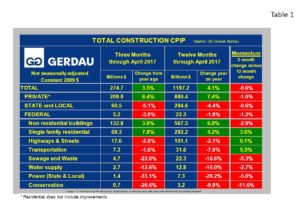
Total Construction: Total construction came in at 3.5% growth on a 3 month y/y, basis and was up 4.1% over the past 12 month y/y period. Non-seasonally adjusted total construction expenditures for the 3 months ending April were $274.7 billion. Twelve month total expenditure was 1.197 billion, (Table 1).
Private construction accounted for 76.1% of the total 3 months expenditures ending in April, leaving 22.0% for State & Local and 1.9% for Federal. The private sector posted growth of 6.4% 3 month y/y and 7.4% on a 12 month y/y comparison. The resultant momentum (3 month subtract 12 month), was negative 1.0%
The rate of growth has been slowly falling in percentage terms, yet has remained positive for 69 consecutive months. Single family residential construction recorded 7.8% growth on a 3 month basis and 4.2% on a 12 month y/y basis resulting in positive momentum of 3.6%.
State and Local total construction contracted further this month, down 5.1%, 3 months y/y and off 4.4% on a rolling 12 month basis. Its 12 month growth rate has been negative for 8 months in a row with each successive month recording a larger negative value than the previous month. Federal construction spending is also weakening, dropping 3.0% on a rolling 3 month y/y basis and off 1.8% on a rolling 12 month y/y comparison.
The infrastructure project groups posted negative growth for both 3 and 12 month y/y comparisons in every category. On a 3 months y/y comparison: highways & streets fell 2.0%, transportation was off 1.6%, sewage & waste down 22.0%, water supply dipped 12.6%, power (State & Local) declines 33.1% and conservation fell by 20.6%. Momentum was negative in all groups except transportation, +5.5% and highways & streets, +0.1%. We keep expecting to see infrastructure spending start to rise as a function of monies rolling in from the $305 billion congressional bill to fund roads, bridges, and rail lines, but have yet to witness this.
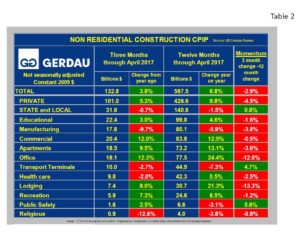
Non-residential Construction: Table 2 shows the breakdown of non-residential construction (NRC). The overall growth rate was 3.8% on a 3 month y/y basis and 6.8% on a 12 month y/y comparison resulting in negative 2.9% momentum.
The growth rate of private NRC was 5.3% for the three months ending April, less than the rolling 12 month value of 9.8% but still showing good growth. Looking at the project categories within non-residential buildings, we have bit of a mixed bag. Spending on education structures was up 3.0% and 4.6% on 3 and 12 month y/y metrics respectfully. Commercial buildings. apartments (>4 stories) and office construction continue to record solid numbers, up 12.0%, 9.5% and 12.3%, 3 months y/y respectfully. Lodging, recreation and public safety also recorded growth.
Sectors that recorded contracting expenditures (rolling 3 month y / y), include: manufacturing buildings, (-9.7%), transport terminals (-2.7%), health-care (-2.0%) and religious buildings (-12.6%).

