Architectural Billings Index
After falling to a disappointing 49.5 in January (any score above 50 indicates an increase in billings), the national ABI rebounded to score 50.7 in February. In an encouraging trend for future non-residential construction activity, the ABI has been greater than 50 for four of the last five months. The ABI typically leads construction put-in-place (CPPI) numbers by 9 to 12 months.
 Regionally the Midwest recorded the strongest score at 52.4, followed by the South at 50.5, the Northeast at 50.0. The West was the only region to record a decline in demand for design services with a score of 47.5. Kermit Baker, American Institute of Architects Chief Economist made the following comments in today’s press release: “The sluggish start to the year in architecture firm billings should give way to stronger design activity as the year progresses. New project inquiries have been very strong through the first two months of the year, and in February new design contracts at architecture firms posted their largest monthly gain in over two years.”
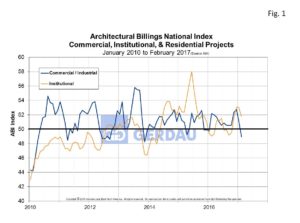
Figure 1 charts the ABI sub-index for commercial / industrial, institutional and multi-story residential (MSR) projects from 2009 to present. Commercial/Industrial stalled from 51.0 in January to 48.9 in February. Institutional recorded 51.8, it fourth month in a row greater than the 50 expansionary threshold.
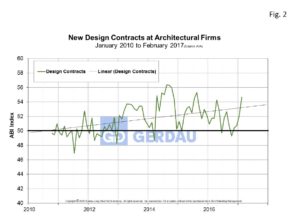
Figure 2 presents awards for design contracts and measures the trends in new design contracts at  architectural firms which provides a strong signal of future billings. The sub-index for design contract awards has been trending up, advancing in each of the last four months to post a score of 54.7 in February.
At Gerdau we follow the ABI because it is a leading indicator of non-residential construction activity. The ABI has a proven track record and as such it is useful for business planning purposes.

