

U.S. Steel Special Bar Quality Final Imports
SBQ final imports to the U.S. were up 28.4% year to date (YTD), year on year (y/y), totaling 526,564 tons for the eleven months ending November 2017. November SBQ imports came in at tons, 48,610, 1.5% higher than the 47,869 ton YTD average volume.
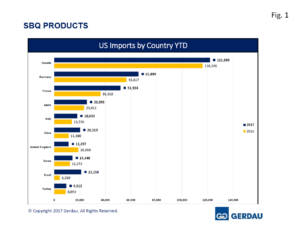 Figure 1 charts the largest exporting countries in rank order on a YTD basis through November for both 2016 and 2017. Three new HTS codes were added this month with history back to July, (they are all SBQ rounds, 0.25 to 0.60 carbon). These tonnages are added into the YTD totals discussed below, but are not reflected in Figure 1. The tonnage for the additional HTS codes amounts to 39,684 for the July to November timeframe. Of this total, rounds <76mm accounts for 86.1%.
Canada was the largest exporter with 169,619 tons, up 20.2% YTD y/y. November’s volume at 11,005 tons, was 28.6% less than its 15,420 ton YTD average volume. Germany sent 91,608 tons to the U.S. YTD, up 27.4% y/y. November exports were 12,044 tons, 44.6% greater than the 8,328 ton average for the year. France ranked third YTD with 67,961 tons up 46.6% YTD y/y. For the month of November, French SBQ exports to the U.S. amounted to 7,930 tons, 28.4% higher than its YTD average of 6,178 tons. Spain exported 28,142 tons YTD, gaining 0.2% YTD y/y. November volume came in at 1,326 tons, 48.2% less than its YTD average volume of 2,558 tons.
China exported 25,847 tons of SBQ, jumping 95.9% YTD y/y. Volume for the November was 2,006 tons, up 48.5% from its 2,348 ton monthly average over the first 11 months of the year. Brazil sent 28,290 tons of SBQ to the U.S., surging 360% YTD y/y. November volume was 2,006 tons, down 22.0% compared to its 2,572 ton YTD average volume. Italy exported 23,973 tons of SBQ products to the U.S. YTD, up 42.0% y/y. November volume was 3,294 tons, 51.1% higher than its YTD average of 2,179 tons. Korea sent 25,762 tons, up 78.4% y/y. Volume for the month of November was 1,140 tons, 51.4% below its YTD average of 2,342 tons. The United Kingdom’s YTD volume of SBQ exports to the U.S. was 15,781 tons, 28.4% less than YTD 2016. November’s exports were 3,165 tons, 121% higher than its YTD average of 1,435 tons. Turkey exported 9,850 tons of SBQ to the U.S. through November, falling 21.7% y/y. Turkey sent 172 tons of SBQ bars to the U.S. in November, 80.8% less than its YTD average of 895 tons.
These top ten countries account for 92.5% of the total SBQ intake. There were 24 other countries that exported a combined 39,750 tons of SBQ YTD 2017. Year to date last year the same 24 country’s total import quantity was 49,904 tons. The top 10 YTD 2016 accounted for 87.8%.
SBQ is broken down into seventeen HTS codes. Leaded coil was the HTS code with the largest import volume at 95,906 tons, up 30.7% YTD y/y. Rounds, (0.25 – 0.6 carbon) came in at 62,771 tons, down 19.3% YTD y/y was the second largest. Rounds, (<3” diameter, 0.25 carbon) at 42,297 tons up 2.9% YTD y/y was the next largest category. Rounds (>0.1% lead) was the next largest at 40,452 tons through November 2017, up 70.4% y/y. The 5th largest category “Other SBQ” imports totaled 39,952 through 11 months, up 95.3% y/y.
Detroit was the largest receiving port, offloading 159,636 tons YTD, up 30.5% YTD y/y. Chicago held the number two spot with 74,319 tons, gaining 17.5% YTD y/y. Buffalo ranked third with 67,070 tons up 1.3% YTD y/y. Houston/Galveston was the next largest port bringing in 43,928 tons YTD, an increase of 80.8% YTD y/y. New Orleans, received 38,533 tons, climbing 24.8% YTD y/y. New York was the 6th largest receiver of U.S. SBQ with 18,319 tons, up 6.4% YTD y/y. St. Albans VT offloaded 18,210 tons, up 35.0% YTD y/y. Miami took-in 16,959, YTD y/y, up from just 657 YTD 2016. Miami did not bring in any tons in November. Mobile was next with 8,826 tons, surging 89.8% YTD y/y. Rounding-out the top 10 was Savannah, bringing in 17,848 tons, surging higher by 49.9% YTD y/y.
Twenty-three other ports combined to receive 54,310 tons of SBQ imports thus far in 2017, 10.3% of the total volume YTD. Year to date 2016 the same country’s combined shipments were 55,118 tons very close to the same as this year but representing a higher, (13.4%) of YTD 2016 total SBQ imports.
At Gerdau we closely follow trade in long products steel since it has a profound impact on domestic market share and material pricing. We want you, our valued customers to have access to current information that can help you better plan and operate your businesses.