

U.S. Steel Rebar Final Imports
Rebar final imports to the U.S. were down 20% YoY, and down 5.4% MoM in March 2019, coming in at 100,866 tons. These include: concrete reinforcing bars and rods of iron or non-alloy steel, in irregularly wound coils hot-rolled, concrete reinforcing bars and rods of other alloy steel, not further worked than hot-rolled, hot-drawn or extruded, and other bars and rods iton or non-alloy steel, hot-worked, concrete reinforcing bars and rods.
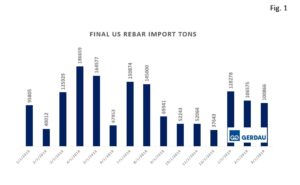 Figure 1 further breaks down total final rebar imports from January 2018 – March 2019. When comparing year to date figures from 2018 and 2019, 2019 imports came in at 335,719, up 28% from 2018 (261,746 tons) .
Figure 2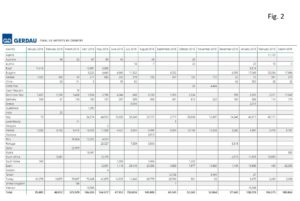 charts the largest exporting countries through January for both 2019 and 2018. Spain was the largest exporter of rebar with 62,050 tons in March 2019, up significantly MoM, with 440 tons exported in February 2019. Bulgaria was the second largest exporter with 17,494. The Dominican Republic was the third largest rebar exporter to the US with 11,649. Together these three exporters accounted for 90.4% of the total.
Miami, FL port was the largest receiver of U.S. rebar in March 2019, receiving 34,592 tons of the total 100,866. Houston/Galveston, TX port was the second largest receiver coming in at 30,424 tons and the New Orleans, LA port was the third largest receiver coming in at 10,450 tons. Together, these top three receiving ports collected 75% of all U.S. merchant imports
At Gerdau we closely follow trade in long products steel since it has a profound impact on domestic market share and material pricing. We want you, our valued customers to have access to current information that can help you better plan and operate your businesses.