

U.S. Steel Merchant Final Imports
Merchant final imports to the U.S. came in at 28,228 tons in July 2019, up 21.6%% month over month (MoM), and up 19.4% year over year (YoY)
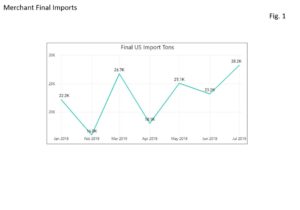 Figure 1 further breaks down total final merchant imports from January 2019 – July 2019. When comparing year to date figures from 2018 and 2019, July 2018 imports came in at 23,641.
Figure 2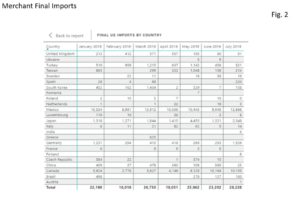 charts the largest exporting countries in rank order through July 2019. Mexico and Canada combined account for 81% of the total in July 2019. Mexico was the largest exporter with 12,686 tons. Canadian imports came in at 10,199 in July 2019.
Laredo, TX port was the largest receiver of U.S. merchants in July 2019, receiving 9,611 tons of the total 28,228. Detroit, MI port was the second largest receiver coming in at 5,186 tons and the Buffalo, NY port was the third largest receiver coming in at 1,869 tons. Together, these top three receiving ports collected 63% of all U.S. merchant imports
At Gerdau we closely follow trade in long products steel since it has a profound impact on domestic market share and material pricing. We want you, our valued customers to have access to current information that can help you better plan and operate your businesses.