

U.S. Steel Merchant Final Imports
Merchant final imports to the U.S. were up 1.2% in 2017, year on year (y/y), totaling 541,630 tons for the twelve months ending December 2017. January merchant imports came in at 37,527 tons, 28.1% less than the 52,203 ton volume in January 2017. There are thirteen HTS codes that combine to total our definition of Marchant Products. The top five account for 64% of the total intake. These include: Light angles (<3” = 7,508 tons), MBQ (coil >0.75” dia. = 4,372 tons), MBQ (rectangular <0.25 carbon, max cross section <152 mm dia. = 4,341 tons), Structural channels (>3,15” = 4,084 tons) and Light channels (>3,15” = 3,680 tons)
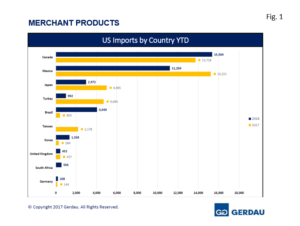 Figure 1 charts the largest exporting countries in rank order through January for both 2018 and 2017. Mexico and Canada combined account for 70.7% of the total in January 2018, up from 69.4% in 2017. Canada was the largest exporter with 15,364 tons, up 12.0% y/y. Mexico sent 11,204 tons to the U.S. in January 2018, down 26.4% y/y. Brazil sent 4,049 tons of merchant products to the U.S. in January 2018, up 906% y/y. Korea exported 1,338 tons In January 2018, a four-fold increase y/y. Japan sent 2,972 tons, 40.5% less than in January 2017. Turkey sent 992 tons of merchants to the U.S. in January 2017, off 78.9% y/y. South Africa’s 2018 January total was 556 tons. South Africa did not ship any merchant tons to the U.S. in January 2017. The United Kingdom’s 2018 January volume of merchant exports to the U.S. was 431 tons, a 0.9% y/y increase. The Czech Republic exported 262 tons of merchants to the U.S. in January 2018. The Czech Republic did not ship any merchant tons to the U.S. in January 2017. Germany exported 208 tons to the U.S. in January 2018, 44.2% more than in January 2017.
These ten countries accounted for 99.6% of the total merchant intake. There were ten other countries that exported a combined 151 tons of merchants in January 2018. In January 2017 the same ten country’s exported 371 tons.
Table 1 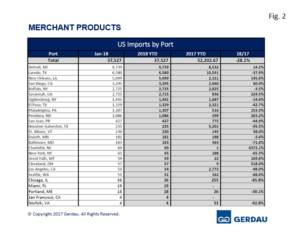 shows the entry port into the U.S. for both January 2018 and January 2017 and the percentage change y/y. Detroit held the number one spot with 9,739 tons, up 14.2% y/y. Laredo TX brought-in 6,580 tons in January 2018, down 10.8% y/y. New Orleans ranked third with 5,699 tons up 146% y/y. San Diego offloaded 3,295 tons, higher by 60.0% y/y. Buffalo took-in 2,725 tons, off 3.5% y/y. Savannah was next with 2,725 tons, lower by 3.5% y/y. Ogdensburg NY, took-in 1,441 tons, down 14.6% y/y. El Paso was the 8th largest receiver of U.S. merchants with 1,329 tons, down 42.7% y/y. Philadelphia, received 1,307 tons in January 2018, higher by 153% y/y. Pembina ND, brought-in 1,086 tons, 263% greater than its January 2017 receipts. San Juan PR, received 427 tons, 44.9% lower y/y. Houston/Galveston offloaded 235 tons in January 2018 plummeting 95.5% y/y.
Fourteen additional ports combined to receive 950 tons of merchant imports in January 2018, 2.5% of the total volume. The same 14 ports took-in 4,164 tons in January 2017.
At Gerdau we closely follow trade in long products steel since it has a profound impact on domestic market share and material pricing. We want you, our valued customers to have access to current information that can help you better plan and operate your businesses.