U.S. Housing Starts and Permits
Referencing the Department of Commerce data, housing starts shot-up 13.7% month on month, (m/m) in October to a seasonally adjusted annualized rate (SAAR) of 1,290,000 units. Multi-family, (MF) surged by 36.8%, while single family, (SF) advanced by 5.3%. Permits increased by 5.9% m/m, up 1.9% for SF and up 13.4% for MF greater than 5+ units.
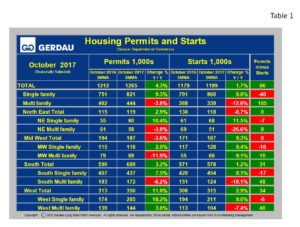
 Table 1 breaks down starts and permit detail for SF and MF by region. All data references are three month moving averages y/y, (3MMA y/y), which helps smooth out spikes in single month data and therefore gives a more realistic viewpoint on the pulse of home building activity. Nationally, SAAR, SF starts were higher by 8.8% y/y. Single family starts were up 11.5% y/y in the Northeast and a 9.0% in the West, 8.1% in the South and higher by 9.4% in the Midwest.
Nationally, SAAR, MF starts fell by 12.6%, 3MMA. Multi-family starts were lower y/y in three of the four regions led lower by a 26.6% plunge in the Northeast, and an 18.1% decline in the South. The West saw MF starts fall by 7.4%. Meanwhile MF starts in the Midwest were up by 9.1% y/y.
Nationally, total SAAR permits increased by 4.3%, 3MMA y/y to 1,265,000 units with SF permits up 9.3% and MF permits down 3.8%. Three of the four regions reported stronger growth in total building permits y/y led by an 11.8% rise in the West. The West’s permits were up 18.2% for SF and +3.8% for MF. The Northeast reported a 2.9% y/y rise in permits, a combination of a 10.4% y/y increase for SF and a negative 3.8% y/y for MF. The Midwest total permits were down 3.6% y/y, (SF +2.0%, MF -11.9%). The South posted overall permit growth of +3.2%, (SF +7.5%, MF -6.2%).
Permits gage future housing builds. The column on the far right in Table1 illustrates permits minus starts. For the nation as a whole permits minus starts = +66,000. This indicates that housing construction should rise in the coming months.
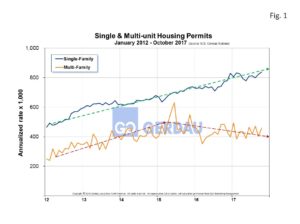
Figure 1 shows SA housing permits history from 2012 to present. Single family is growing at a steady rate. Recently multi-family starts have plateaued. Relative to history, multi-family starts are higher than during the pre-recession time-period.
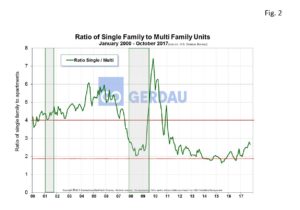
 Figure 2 illustrates the ratio of SF to MF from 2000 to present. Pre-recession the ratio of SF:MF was in the 5:1 to 6:1 range. This ratio plummeted after the recession as demand shifted towards apartments. The ratio fell below 2:1 throughout most of 2014 and 2015 and is now trending higher. The 3MMA was 2.7:1 in October. The ratio has been trending steadily higher over the past year.
This shift means that consumers have gained sufficient confidence in the strength of the economy to step-up and purchase a SF house. In addition to a higher consumer confidence level, the National Association of Home Builders, (NAHB) reported a score of 70, (>50 indicates a favorable outlook) on its Housing Market Index, up 7 points from November 2016. The sub-index was the strongest in the West at 77, followed by a score of 72 in the South, a 65 in the Midwest and a 63 in the Northeast. The NAHB expects the new home market to continue to strengthen at a modest rate for the foreseeable future.
At Gerdau, we routinely monitor the US housing market because historically new home construction has preceded non-residential construction and therefore is an excellent barometer to foresee the likely future demand for construction steel products.

