Producer Price Index for Construction
The November Bureau of Labor Statistics producer prices index, (PPI) for all commodities was up 0.5%, (m/m). On a 12 month year on year, (y/y) comparison, the all commodities PPI rose 4.4%. The all commodities index has moved higher in each of the last 12 months on a y/y basis. Goods prices rose 1.0%. Goods prices got a boost from higher energy prices as energy prices moved up 4.6%. Excluding food and energy, core goods prices increased by a much smaller 0.3%. Services prices gained 0.2% in November. Most analysts expect a rate hike by the Fed to be announced at its meeting later this week.
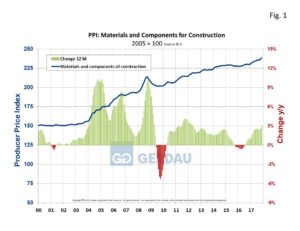
 Figure 1 shows the 3MMA, materials and components PPI for construction from 2000 to present. The material and construction components PPI increased by +0.7% over three months, +1.6% over six months, +3.0% over 12 months and by +4.0% over a 24 month interval. On a rolling 12 month basis, the material and construction component PPI has advanced for 17 consecutive months.
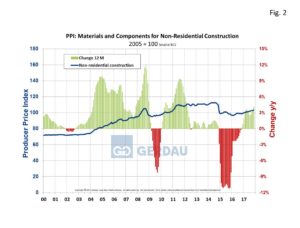
Figure 2 shows the 3MMA, material and components for non-residential construction PPI from 2000 to present. The non-residential construction PPI rose increased by +1.2% over three months, +2.3% over six months, +4.1% over 12 months and by +4.4% over a 24 month timeframe. In a recent report from the American General Contractors, it highlights that; "a handful of contacts indicate wallboard is at least on partial allocation." Buyers expect that a double digit January price hike will stick. Several other material suppliers have announced significant price hikes to include concrete, steel studs, wire mesh, insulation and flooring products. The non-residential construction PPI has been increasing at faster clip than the overall commodities index over the past 12 months. On a rolling 12 month basis, the material and construction component PPI has increased in each of the past 13 months.
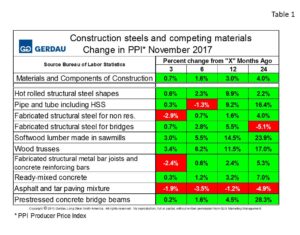
 Table 1 charts construction steels and its competing materials. The overall number for all materials and components of construction was up 0.7% over the past three months and up 3.0% y/y. According to the BLS, structural steel shapes prices are moving-up, advancing 0.6% over 3 months and by 9.9% y/y. The PPI for pipe, tube and hollow structural shapes moved-up 0.3% over 3 months, and was up 9.2% y/y. The PPI for fabricated steel for non-residential construction fell 2.9% over three months, but was higher by 1.6% on a 12 month basis. Fabricated structural steel for bridges was up 0.7% over the last three months and was higher by 5.5% over 12 months. Fabricated bar joist and fabricated rebar, (grouped together in one category) fell 2.4% over 3 months but rose 2.4% on a y/y comparison. Prestressed concrete bridge beams managed a 0.2% gain 3 months y/y and were higher by 4.5% when compared to November of 2016.
The PPI for non-residential structures moved-up 1.2%, 3 months y/y and by 4.1% on a y/y comparison. Commercial building exhibited the strongest price gains, rising 1.1% over three months and by 4.1% over 12 months. Office structures were flat 3 months y/y and up by 2.1%, 12 months y/y. Industrial structures were also flat 3 months y/y but were up by 1.8%, on a 12 month y/y comparison.
At Gerdau, we monitor the PPI which is issued monthly from the Bureau of Labor Statistics because our past analysis has led us to believe that the BLS PPI numbers measure-up to real-world pricing. We feel it is important for us and our customers to know where we are pricing-wise relative to history and how we stack-up against competing materials.

