Portland Cement Shipments
Cement consumption moved-up in July for the second month in a row. For the three months total (3MMT), ending July, national Portland cement shipments rose by 2.6% on a 3MMT year on year (y/y), basis. Five of the nine census regions posted higher 3MMT cement shipments y/y.
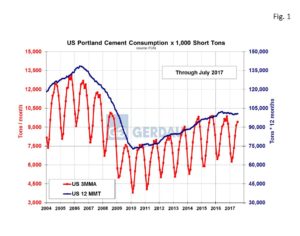
 Figure 1 shows the three month moving average shipments in tons per month on the left-hand Y axis and the 12 month moving total on the right-hand Y axis. Note that 12 month moving total, (12MMT) growth has plateaued over the last several months, after steadily rising since the recession ended. Year to date through July, cement shipments totaled 56.15 million short tons (Mt), down 0.3% y/y.
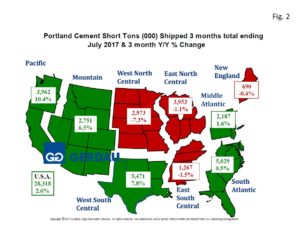
Figure 2 presents a map of the US by census region. The tonnage values are in 3MMT and the percentage change is 3MMT y/y. Green denotes growth, red means decline. The country as a whole recorded an increase of 2.6%, 3MMT y/y with shipments of 28.32 Mt for the 3 months ending July 2017 compared to 27.61 Mt for the same period last year.
The largest consuming region was the West South Central with 5.47 Mt, up 7.8%, 3MMT y/y. The region with the second largest 3MMT consumption, (5.03 Mt) was the South Atlantic. Shipments in the South Atlantic increased by 0.5%, 3MMT y/y. The third highest consuming region was the Pacific, with 3.92 Mt, a decrease of 1.1% 3MMT y/y. The East North Central consumed 3.96 Mt, 3MMT, advancing 10.4% y/y. The Mountain zone region posted 6.5%, 3MMT y/y growth for the three months ending July, consuming 2.75 Mt of cement. The middle Atlantic recorded growth of 1.6% 3MMT y/y, with 2.19 Mt of cement used in May, June and July. The East South Central saw its cement consumption fall 1.5% 3MMT y/y to 1.26 Mt. New England’s three month volume was 690 Mt. falling 0.4%, 3MMT y/y.
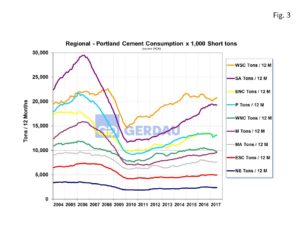
Figure 3  illustrates the census regions historic growth from 2004 to present. The two volume leading regions include the West South Central (22% of total US shipments year to date), and the South Atlantic (20% of US total shipments year to date). The South Atlantic region has been trending steadily higher but has plateaued over the last couple of months. The West South Central after falling through most of 2016, has reversed course and has trended higher thus far in 2017.
The third largest consuming region over the past three months was the Pacific region with 13% of total cement shipments. The East North Central region ranked the next largest with 12%, followed by the Mountain zone at 10%. The remaining four census regions combined to add up to 23% of total shipments.
The Portland Cement Association, (PCA) revised downward its Summer 2017 forecast projections for both 2017 and 2018. “While our macroeconomic and much of our construction spending projections remain on target, weather and public construction sector have prompted the adoption of a more modest growth outlook.” The Portland Cement Associations revised growth projections are now 2.6% for 2017 and 2.8% for 2018. It was noted that the revised assumptions assume tax reform and a $250 billion national infrastructure program spearheaded by the Trump administration and Congress. The cash from said program would not be expected to flow until mid-2019.
Cement capacity utilization in the U.S. is reportedly tightening and rebuilding and repair work from hurricanes Harvey and Irma will place additional demands on supply. There is no potential for shortages. According to PCA the U.S. cement industry has capacity for even the most optimistic infrastructure spending program.
At Gerdau we routinely monitor Portland cement shipments because of its strong relationship to the consumption of rebar and because cement shipments give an excellent on how the overall construction (infrastructure, residential and non-residential buildings), market is performing. Portland cement shipment data comes from the United States Geological Survey (USGS). Shipment data is two months in arrears.

