

Oil and Gas Rotary Rig Counts
Oil and Gas Rotary Rig Counts: The total number of operating rigs in the U.S. the week as of December 13th was 667 oil and 129 gas (totaling 796). In percentage terms, on a month on month, (m/m) basis, oil rigs were down 1.0% and gas down 0.0%. On a year on year, (y/y) comparison, rigs were down 23.6% for oil and down 34.8% for gas. The combined figure for YoY was -25.4% or -272 rigs.
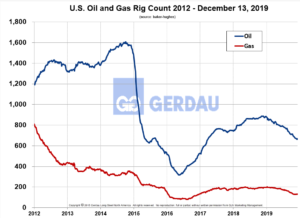 Figure 1 shows the Baker Hughes U.S. Rotary Rig Counts for oil and gas equipment in the U.S. from 2012 to present. Oil rigs rose have dropped below 1,000 rigs starting in April of 2019 and landing at 799 this week. Gas rigs bottomed-out at 81 in August 2016 then rose steadily topping out at 129 this week.
For the week ending December 13th, Texas was operating 400 rigs (50.0% of the total), followed by Oklahoma with 50, (6.3%), New Mexico with 102, (12.8%). Louisiana had 34 on-land and 22 off-shore, (7%). North Dakota’s count was 50, (6.3%). These five states together account for 82.4% of the nation’s rig count.
Thanks to the shale boom, new U.S. supply will cover more than half the world’s oil demand growth to 2023, the agency said. Production from the prolific Permian Basin will double over the period and the country’s total liquid hydrocarbon output will rise to 17 million barrels a day from 13.2 million last year. The American surge and a slightly weaker outlook for global demand growth make uncomfortable reading for OPEC. The IEA slashed projections for the amount of crude needed from the cartel, indicating its supply cuts would need to stay in place until 2021 to avoid creating another prolonged surplus.
At Gerdau we monitor rig counts along with the price of oil and natural gas since it has a major impact on long product sales to include Special Bar Quality sucker rods for downhole pumping strings to merchant and structural products for rigs and oilfield equipment.