Construction Put-in-Place (CPIP) March 2017
Construction put-in-place (CPIP), March 2017: March CPIP data released today (May 1st), yielded mixed results. Overall total construction posted positive growth. Private expenditures showed positive growth, however, State & Local spending continued to contract.
The data presented in this report are not seasonally adjusted (NSA) and are in constant 2009 dollars.
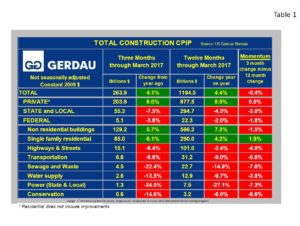
Total Construction: Total construction came in at 4.1% growth on a three month year over year (y/y), basis. This was down 0.3% compared to the 4.4% growth recorded over the past 12 month y/y period. Non-seasonally adjusted (NSA), total construction expenditures for the three months ending March were 263.9 billion. The 12 month running total was 1.195 billion, (Table 1).
Private construction accounted for 77.1% of the total three months expenditures ending in March, leaving 21.0% for State & Local and 2.1% for Federal. The private sector posted growth of 8.0% for both 3 and 12 month y/y comparisons resulting in flat momentum. The rate of growth has been slowly falling in percentage terms, yet has remained positive for 66 consecutive months. Single family residential construction recorded 5.7% growth on a three month basis, down a little from the 7.3%, 12 month y/y score.
State and Local total construction contracted further this month, off 4.5% on a rolling 12 month basis. This value been negative for seven months in a row with each successive month recording a larger negative value than the previous month. On a rolling three y/y comparison, growth was down 7.5%, now 10 consecutive months of accelerating declines in percentage y/y terms. Thus momentum was negative 3.0%. Federal construction spending is also weakening, dropping 3.8% on a rolling three month y/y basis and off 2.0% on a rolling 12 month y/y comparison.
The infrastructure project groups posted negative growth for both 3 and 12 month y/y comparisons, ranging from -6.4%, 3 month y/y for highways & streets to -34.5% for power projects. Momentum was also negative in every case. The $305 billion congressional bill to fund roads, bridges, and rail lines that was authorized in December 2015 was the largest re authorization of federal transportation programs approved by Congress in more than a decade, ending a prolonged period of short term stopgap bills. It would seem that some of this money would have found its way into infrastructure projects by now some 15 months after the passage of the bill. The results in presented in Table 1 indicate that this is not the case.
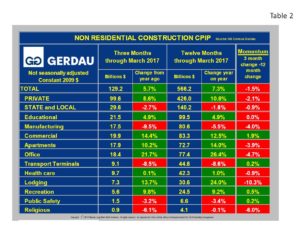
Non-residential Construction:  Table 2 shows the breakdown of non-residential construction (NRC). The overall growth rate was 5.7% on a 3 month y/y basis and 7.3% on a 12 month y/y comparison resulting in -1.5% momentum.
The growth rate of private NRC was 8.6% for the three months ending March, less than the rolling 12 month value of 10.6% but still showing strong growth. Looking at the project categories within non-residential buildings, we have bit of a mixed bag. Commercial, apartments (>4 stories), office, education, lodging, healthcare and recreation construction are all witnessing growth. These range from 0.1% (rolling 3 month y / y), for healthcare to 21.7% for office construction. Momentum was positive for commercial, and recreational, negative for apartments, office, lodging and healthcare, neutral for education.

