Construction Put-in-Place (CPIP)
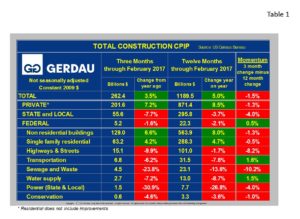
The US Census Bureau today, (April 3rd) reported that total construction spending non-seasonally adjusted, in constant 2009 dollars increased 5.0% year on year for the 12 months ending February 2017. On a three month year on year comparison, spending rose a slightly lower 3.5%. Private spending grew by 8.5% year on year (y/y), while State and local and Federal spending fell 3.7% y/y and 2.1% respectfully.
 Table 1 displays non-seasonally adjusted (NSA), total construction expenditures by sector on a three month moving average (3MMA) and a 12MMA year over year basis to eliminate seasonality or volatility that occurs month to month. Over the last 12 months non-seasonally adjusted construction spending totaled $1,189.5 billion, (constant 2009 dollars). Single family residential construction spending climbed 4.7%. Non-residential spending also posted solid results, up 8.0%. Spending for highways, streets and transportation was down 1.7% y/y, while spending on other infrastructure projects such as water supply, power and sewage/waste all fall y/y.
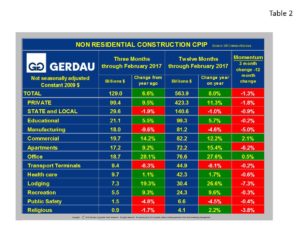
 Table 2 drills down into the detail of non-residential construction (NRC), on a NSA basis in 3 months y/y to $135.7 billion. On a 12 month y/y comparison spending reached $562.3 billion over the past 12 months. On a 3 month y/y comparison, expenditures totaled $129 billion, up 6.6% vs. the same timeframe a year ago.
Private NRC surged by 11.3%, y/y and by 9.5%, 3 months y/y. State and Local NCR fell 1.0% y/y and by 1.9%, 3 months y/y. Office building construction surged 27.6%, y/y and an even stronger 28.1% on a 3 month y/y metric. Apartments/condos (> 4 stories) rebounded after plateauing for several months, up 15.4% y/y as demand for housing is on the rise. This trend is expected to continue as low rental vacancy rates from across the country promote more building especially for multi-family. We expect to see housing construction accelerate as the year progresses as the eight yearlong expansion continues.
Lodging construction activity also continues to perform well, up 26.6% year on year. Other project group posting solid growth include: Commercial structures (+12.2% y/y), Recreation (+9.6% y/y) and recreation (+5.7% y/y). Project groups posting significant declines include: Transportation terminals (-8.8%, 3 months y/y), Manufacturing buildings (-6.3%, 3 months y/y) and Public safety (-5.7%, 3 months y/y).
An encouraging sign that the construction sector will likely continue to expand, is the growing number of workers in this field. Construction employment data from the Bureau of Labor Statistics reported that (SA) construction employment was up in 43 states on a y/y comparison, leaving just seven states with declining numbers. The total number of people employed in this sector was 4.2 million.
At Gerdau we monitor the CPIP numbers every month to keep you, our customers informed on the health of the US construction market. The present market continues to record solid gains.

