

Construction Put-In-Place (CPIP)
CPIP is based on construction spending work as it occurs. Data released by the US Census Bureau on March1st reported that total construction spending increased 5.9% year on year for the 12 months ending January 2017. On a three month year on year comparison, spending rose a slightly lower 4.9%.
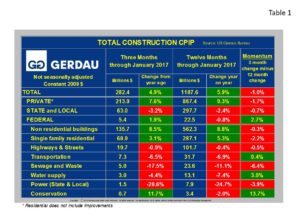 Table 1 displays non-seasonally adjusted (NSA), total construction expenditures by sector on a three month moving average (3MMA) and a 12MMA year over year basis to eliminate seasonality or volatility that occurs month to month. We consider four sectors within total construction, non-residential, residential (with and without improvements), infrastructure and other; which includes industrial, utilities and power. In the last 3 months non-seasonally adjusted construction spending totaled $282.4 billion rising 4.9% year on year (y/y). In the 12 months through January 2017 construction spending totaled $1187.6 billion, an increase of 5.9% y/y compared to the same time frame ending January 2015. However momentum (3 month subtract 12 month) was negative (-1.0%), signaling that construction activity is slowing slightly. Reviewing the breakdown of expenditures, the growth rate of private construction rose 7.6% in the last three months, while public construction spending was a mixed-bag, with State and Local construction was down 3.2% 3 months y/y while Federal spending was up 1.9 % 3 months y/y. Spending for highways, streets and transportation was depressed, down 0.9% and 6.5% 3 months y/y respectively, while spending on vital infrastructure projects such as water supply, power and sewage/waste continue to plummet, down 4.4%, 28.6% and 17.5% and respectfully.
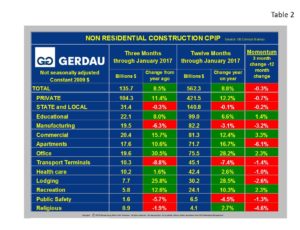 Table 2 drills down into the detail of non-residential construction (NRC), on a NSA basis. Total NRC expenditures increased by 8.5%, 3 months y/y to $135.7 billion. On a 12 month y/y comparison spending reached $562.3 billion, an 8.8% y/y increase. Private NRC surged by 11.4%, 3 months y/y and by 12.2% 12 months y/y while State and Local NCR fell slightly. The big movers were office buildings (+30.5%, 3 months y/y), lodging construction (+28.8%, 3 months y/y) and commercial structures (+15.7%, 3 months y/y). Project groups posting significant declines include: Transportation terminals (-8.8%, 3 months y/y), Manufacturing buildings (-6.3%, 3 months y/y) and Public safety (-5.7%, 3 months y/y).
At Gerdau we monitor the CPIP numbers every month to keep you, our customers informed on the health of the US construction market. The present market continues to record solid gains.