Architectural Billings Index
The national ABI score for October rebounded to 51.7 after dipping below the 50 threshold in September. Regional monthly scores were: The South 50.8, Midwest 49.0, Northeast 54.0 and the West 49.8.
The Architecture Billings Index (ABI), is a leading economic indicator that provides an approximately nine to twelve month glimpse into the future of nonresidential construction spending activity. The results are seasonally adjusted to allow for comparison to prior months. Scores above 50 indicate an aggregate increase in billings, and scores below 50 indicating a decline.
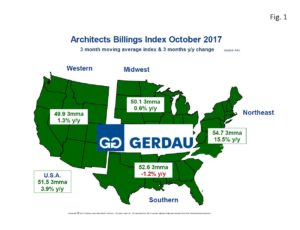
 Figure 1 presents a map of the U.S. depicting the four ABI regions. It is color coded to show expanding billings and increased growth in green and declining billings and negative growth in red. The data is shown on this map is as three month moving averages (3MMA), and 3 month year on year (y/y), percent change.
On a 3MMA basis, the U.S. ABI score was 51.5 with a 3.9% annual growth rate. The Northeast region posted the highest 3MMA ABI at 54.7, it had a 12MMA of 52.3. The South recorded a 52.6, 3MMA ABI and the highest y/y 12MMA at 53.5. The Midwest scored a 49.0, 3MMA ABI, and a 52.1, 12MMA. The Western region recorded a 3MMA of 49.9 and a 12MMA of 50.2.
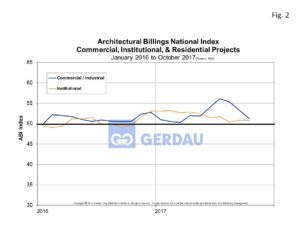
Figure 2  charts the ABI sub-index for Commercial / Industrial and Institutional from 2016 to present. The Commercial/Industrial sub-index declined 2.1 points to 51.2 in October. The index has been greater than 50 for 21 consecutive months. The Institutional sector scored a 50.7, up 0.1 point, its 12 month in a row greater than 50. The non-residential construction market has posted twelve month moving total growth for 69 consecutive months according to construction put in place, (CPIP) data from the U.S. Census Bureau.
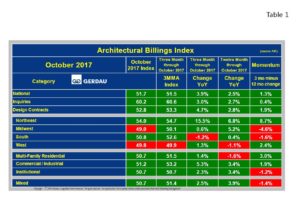
Table 1 lists the overall ABI and all of its sub-indexes. It presents and compares monthly and 3MMA data, showing percentage point change on both three and 12 month basis, as well as momentum. Green denotes positive change, while red indicates negative growth. National momentum, (3 month y/y subtract 12 month y/y) was positive 1.3%. Inquiries momentum was up 0.4%, while Design contract momentum was up a 1.9%. Regionally, momentum was mixed with two of the four zones posted positive momentum; Northeast +8.7% and West +2.4%. The South was down 1.6%, while the Midwest recorded a negative 4.6%. Multi-family residential Commercial / Industrial all recorded positive momentum. Only the Institutional project sub-index showed negative momentum, off 1.2%.
In its release today, AIA Chief Economist, Kermit Baker, Hon. AIA, PhD, quoted the following:
“As we enter the fourth quarter, there is enough design activity occurring that construction conditions should remain healthy moving through 2018. Extended strength in inquiries and new design contracts, along with balanced growth across the major building sectors signals further gains throughout the construction industry.”
Overall the October ABI report indicates points to continued growth in the non-residential construction sector.
At Gerdau we follow the ABI because it is a leading indicator of non-residential construction activity. The ABI has a proven track record and as such it is useful for business planning purposes.

